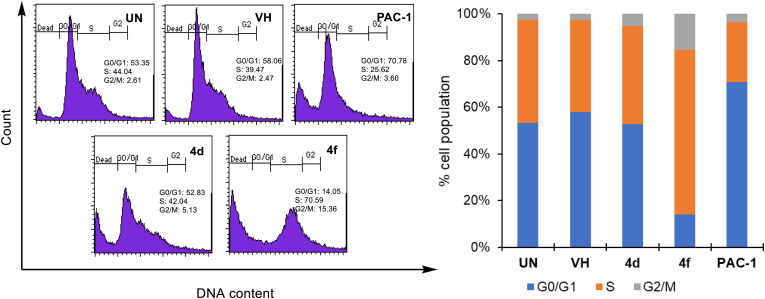
Figure 4.
Cell cycle analysis of some compounds. U937 5 × 10⁵ cells/well seeding (2.5 × 10⁵ cells/ml, 2 ml/well, six well) were treated with compounds (50 µM) for 24 h. The harvested cells were stained with propidium iodide (PI) in the presence of RNase and then were analysed for DNA content. UN: untreated; VH: vehicle (DMSO. 0.05%). Data were represented as histograms (left) and bar graphs (right).

