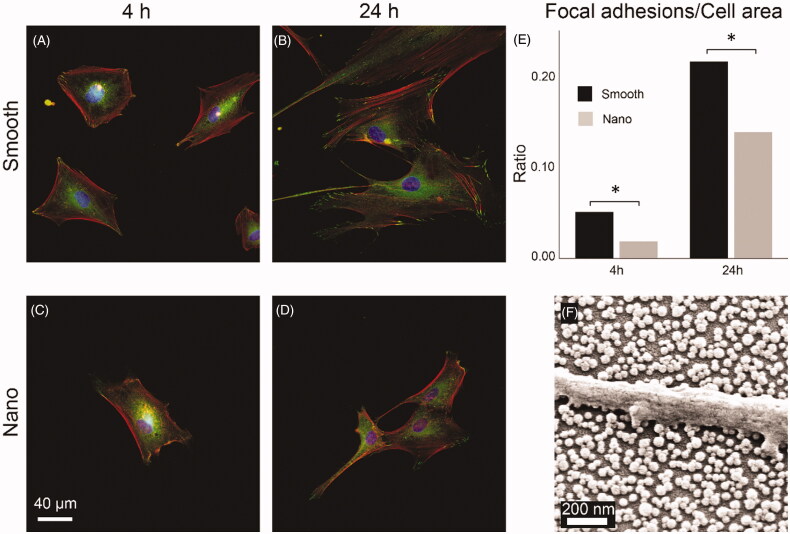
Figure 7.
HDFa cells (A–D) stained for nucleus (blue), actin filaments (red), and focal adhesions (green) viewed at 400× magnification after culturing for 4 and 24 h on smooth and nanostructured surfaces. E: ratio between the number of pixels counted for focal adhesions and for the total cell area. (*p < 0.05). f: SEM image of HDFa cell filopodium resting on top of the SiO2 nanoparticles with no contact with the area in-between.

