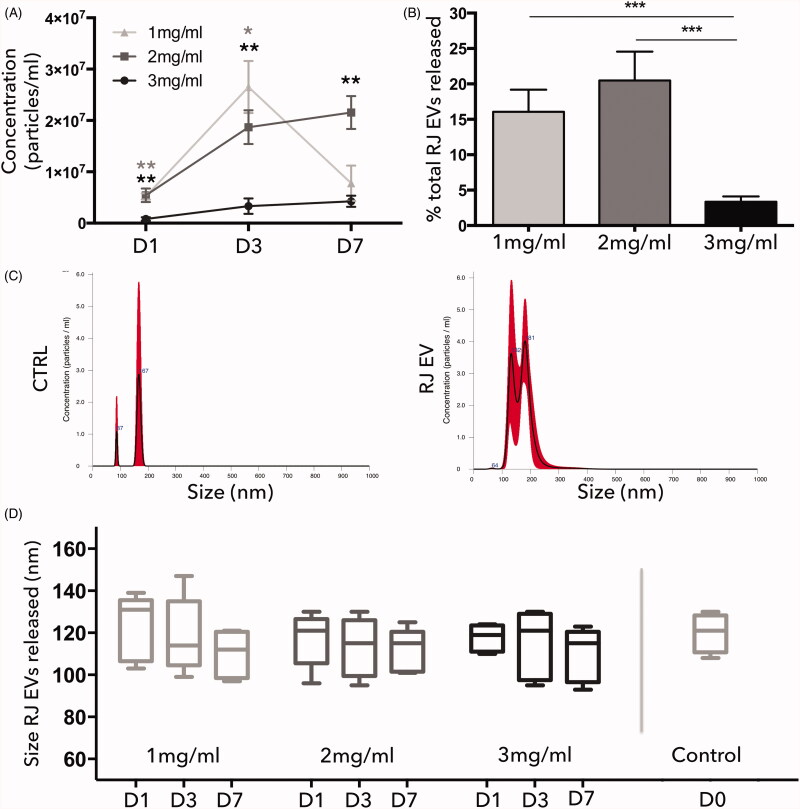
Figure 2.
Release kinetics of type I collagen and RJ EVs; (A) NTA analysis of particles released into the surrounding medium from 1 mg/ml (light gray), 2 mg/ml (dark gray), and 3 mg/ml (black) collagen gels on day 1, 3, and 7; Concentrations displayed as particles/ml; (B) Cumulative RJ EVs released from 1 mg/ml, 2 mg/ml, and 3 mg/ml collagen gels after 7 d; data displayed as percentage of initial RJ EVs integrated into the gels; (C) representative NTA histogram of Ctrl (PBS incubated with collagen without RJ EVs) and RJ EVs released from collagen gels; (D) Median size of RJ EVs released from 1 mg/ml, 2 mg/ml, and 3 mg/ml collagen gels on day 1, 3, and 7 and prior to integration into collagen gels (control); A, B, D: n = 5; mean ± SD; statistics described in methods.

