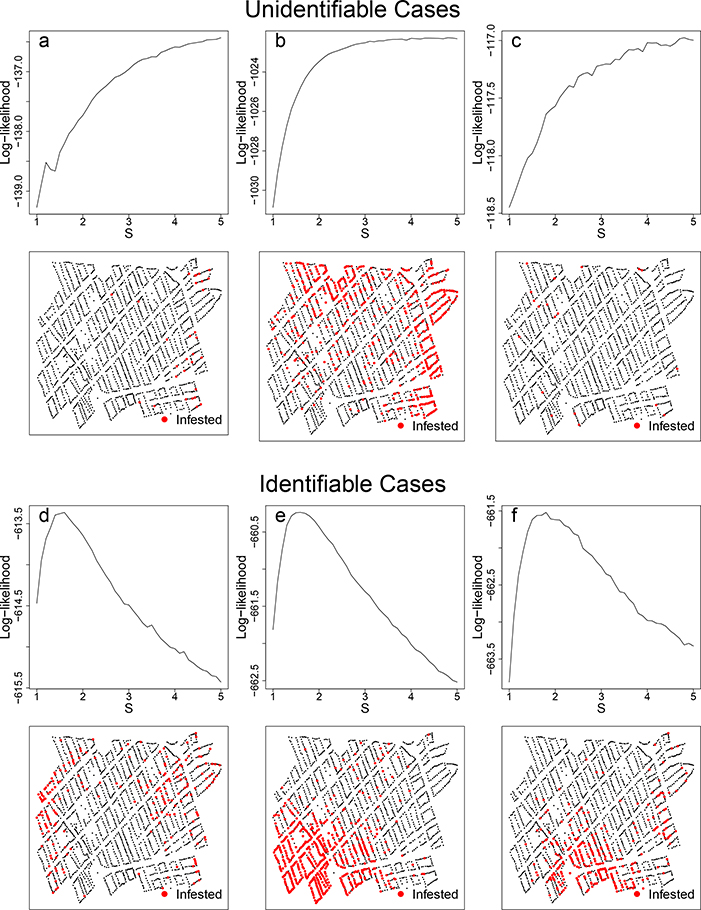
Figure 3:
Three unidentifiable and identifiable log-likelihoods and the corresponding simulated datasets. Unidentifiable landscapes were uncommon, (rates varied based on the true parameter values of κ and ) and in most cases had scarce infestations (panels a and c). Occasionally, an unidentifiable landscape was oversaturated and also unidentifiable (panel b). For comparison, most simulated datasets were identifiable with clear maximums of the log-likelihoods (panels d, e, and f)

