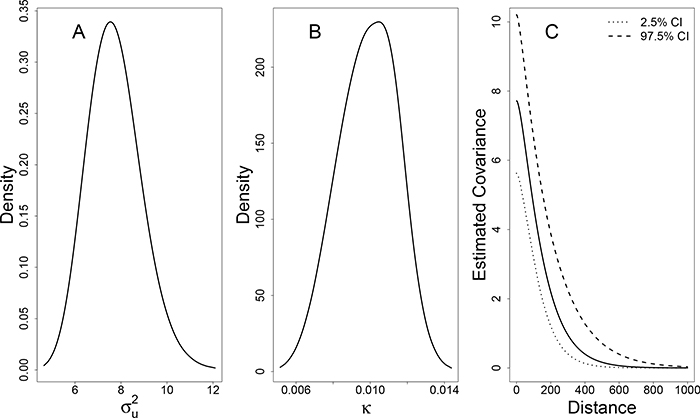
Figure 6:
Posterior distributions of estimated parameters when S = 1.5. A. Posterior distribution of B. Posterior distribution of κ. C. Estimated posterior distribution of Matérn covariance, as a function of distance. For reference, when the map is scaled to S = 1.5, the average distance between nearest neighbors on the same block is 10.2 (sd = 5.5) and the average distance between nearest neighbors on different blocks is 62.4. (sd = 18.0)

