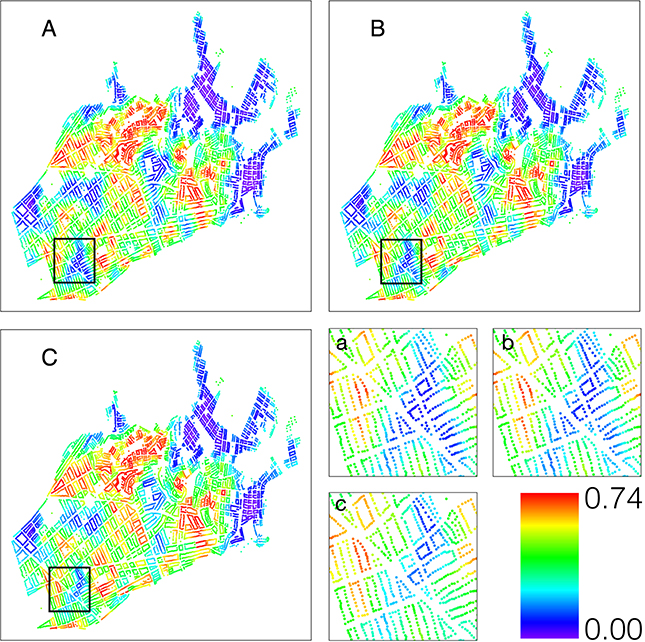
Figure 7:
Risk map of predicted probabilities of infestation using A) S = 1 (true map) B) S = 1.5 and C) S = 3. The last panel shows differences in risk between scales of the area enclosed in the black rectangle in more detail. The color scale ranges from 0.74 (red) to 0.00 (purple). The map is made using a UTM projection.

