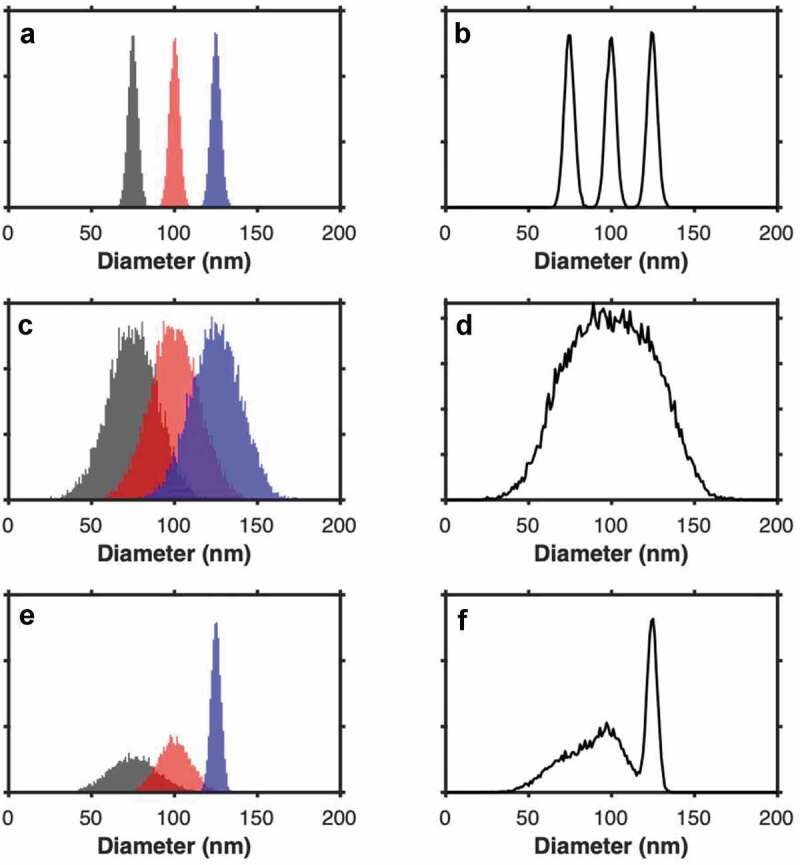
Figure 1.

The importance of resolution. a) demonstrated the detection of particles with a consistently high resolution (µ = 75, 100, 125 nm, σ = 3, 3, 3), b) shows the cumulative diameter distribution of particles from plot a. c) demonstrated the detection of particles with a consistently low resolution (µ = 75, 100, 125 nm, σ = 15, 15, 15), d) shows the cumulative diameter distribution of particles from plot c. e) demonstrated the detection of particles with a typical detection technique resolution, whereby it decreases as the signal becomes smaller (µ = 75, 100, 125 nm, σ = 15, 10, 3), f) shows the cumulative diameter distribution of particles from plot e. All populations have 10,000 particles.
