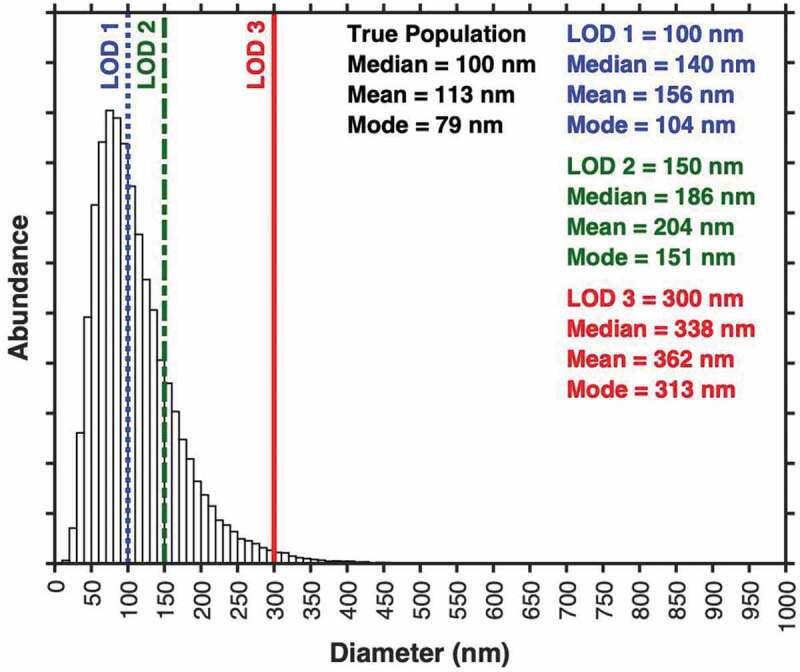
Figure 6.

Limitations of statistical metrics on partially resolved populations. Shown is a hypothetical dataset with log-normal diameter distribution. Three limits of sensitivity (100 nm, blue; 150 nm, green; 300 nm, red) are shown. The summary statistics for events above these limits of sensitivity are shown in the corresponding colours in the right of the plot.
