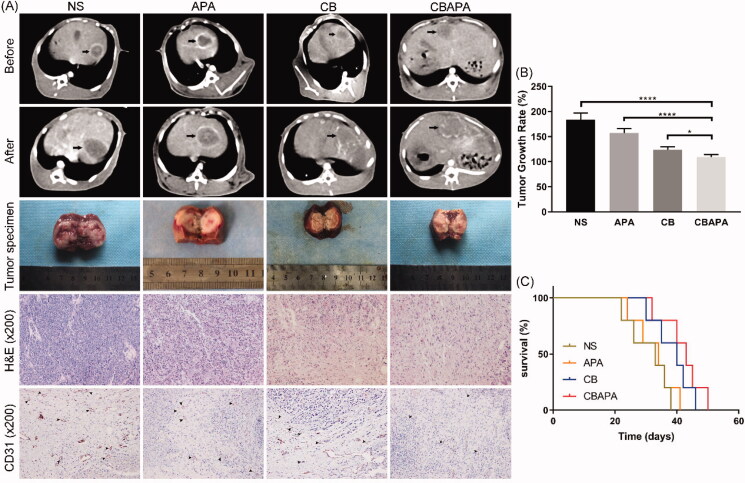
Figure 5.
Tumor response in vivo. (A) Abdominal dynamic CT scan was performed on rabbits before and 7 days after treatment. The tumor specimen of each rabbit liver was taken 7 days after treatment. Further, histopathology of H&E staining and CD31 staining were performed on the specimens. (B) Tumor growth rate in the four groups. ****p < .0001, *p < .05. (C) Survival curves in the four groups.

