
Figure 1.
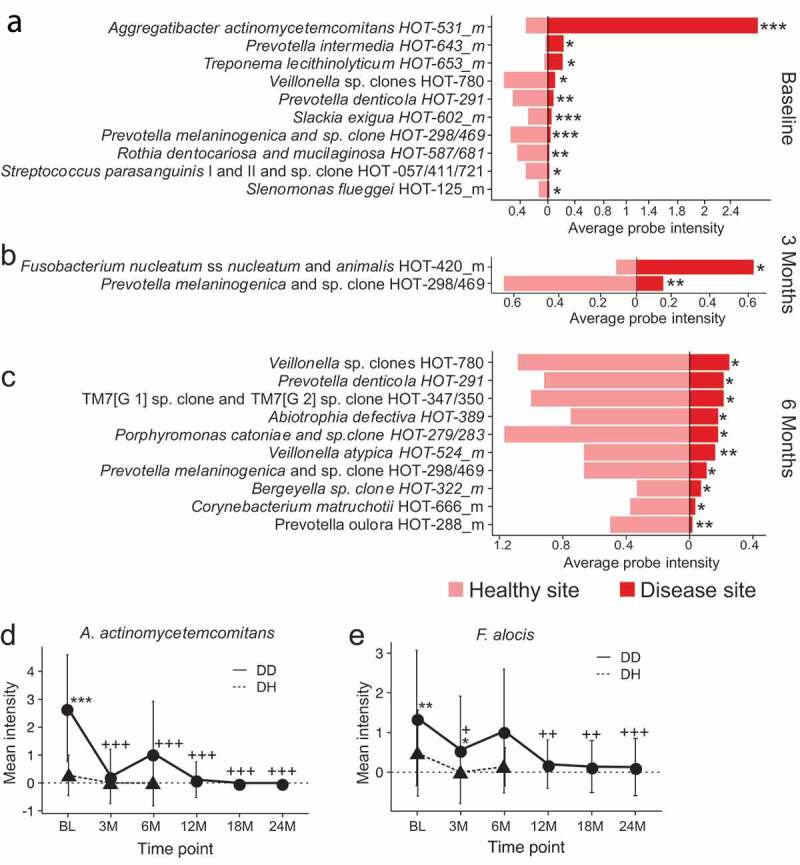
Differentially abundant species between disease and healthy sites before and after treatment in C/MIP patients. Species with a significant 2-fold difference in intensity between DD and DH sites at (a) Baseline, (b) 3 months post-treatment, and (c) 6 months post-treatment. (d) Mean intensity of A.a. in DD and DH sites through the study period. E. Mean intensity of F. alocis in DD and DH sites through the study period. DH site samples from 12 M, 18 M, and 24 M had too little material for HOMIM analysis. Values are mean ± SD. *P < 0.05, **P < 0.01, ***P < 0.001 between DD and DH. +P < 0.05, ++P < 0.01, +++P < 0.001 in DD compared to baseline. DD – diseased sites in C/MIP; DH – healthy sites in C/MIP.