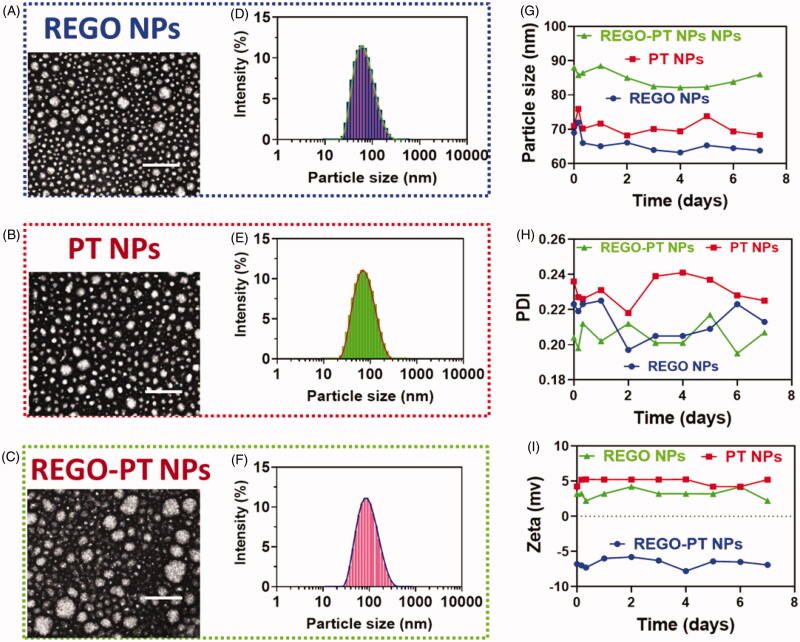
Figure 2.
Characterization of the nanoparticles. (A–F) Morphology and particle size of REGO NPs, PT NPs and REGO-PT NPs under a transmission electron microscope after negative staining with sodium phosphotungstate solution (2%, w/v). Scale bar: 20 nm. Particle size distribution of REGO NPs, PT NPs and REGO-PT NPs analyzed by dynamic light scattering via a Zetasizer. (G-I) Stability of the REGO NPs, PT NPs and REGO-PT examined by the dynamic light scattering.

