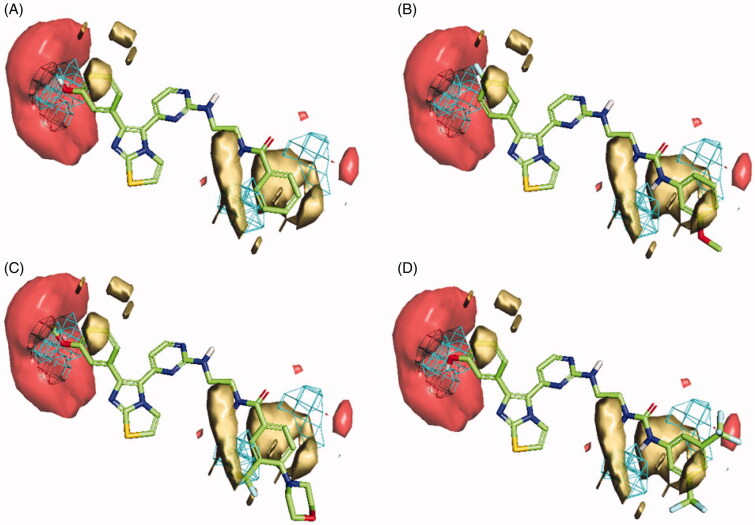
Figure 8.
Flap® 3 D-QSAR model generated for the V600E-B-RAF compounds; (A) alignment of the most potent compound 1zb, (B) alignment of compound 1b, (C) alignment of compound 1z, (D) alignment of compound 1t. The GRID molecular interaction fields are shown as; cyan (Shape), yellow (hydrophobic) and red (HBA).

