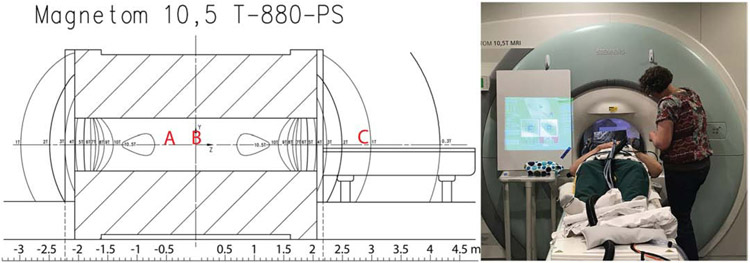
Figure 2.
Field plot for 10.5T system (left) and photograph of one subject before an imaging study (right). The field plot shows contour lines for 1T-10T; the isocenter is at 10.498T, and the small bubbles labeled 10.5T are above 10.5T. For body studies, the subject’s head was at approximately location A; for head studies the head was at isocenter in location B. Supine physiological monitoring was also done at “home”, with the table out; the subject’s head was approximately at position C, with a field of around 1T. The photograph shows the setup for a body imaging study; the white board to the left of the bore shows the eyetracking system setup screen to enable aiming the camera at the eyes and focusing the lens.

