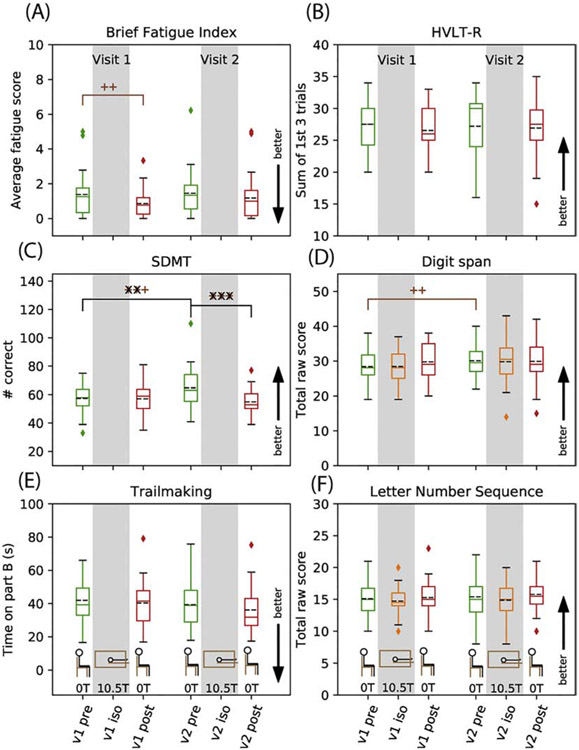
Figure 4.
Cognitive test results for executive function and fatigue: Brief Fatigue Index (A), Symbol Digit Modalities Test (C) and Trailmaking Test (E) and for working memory: Hopkins Verbal Learning Test, Revised (B), WAIS-IV Digit Span (D) and WAIS-IV Letter Number Sequence (F). Data are shown as box and whisker plots: the dashed black line represents the mean, the solid line is the median, the box is the interquartile range, the whiskers are +/−2.698 σ, and the diamonds represent outlier points. Unadjusted statistical significance for isocenter, short term, and long term effects are indicated by p<0.05 (+), p<0.01(++), p<0.001(+++); resampling-method adjusted p-values are overlain as x for the same p-value cutoffs. Timepoint is indicated by color: pre (green), isocenter (orange), post (red).

