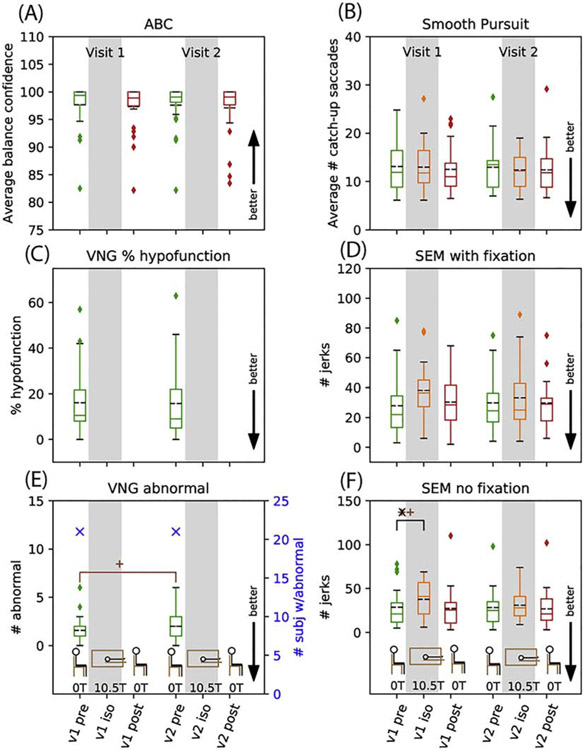
Figure 5.
Vestibular results: Activity Specific Balance Confidence (A), videonystagmography (VNG) caloric hypofunction (C) and VNG number of subjects with any abnormal results and average number of abnormal results (E), and for lab eyetracking: average number of catch-up saccades in 6 smooth pursuit trials (B), number of jerks in spontaneous eye movement with fixation (D) and without fixation (F). Data are shown as box and whisker plots with statistical significance as described in Figure 3.

