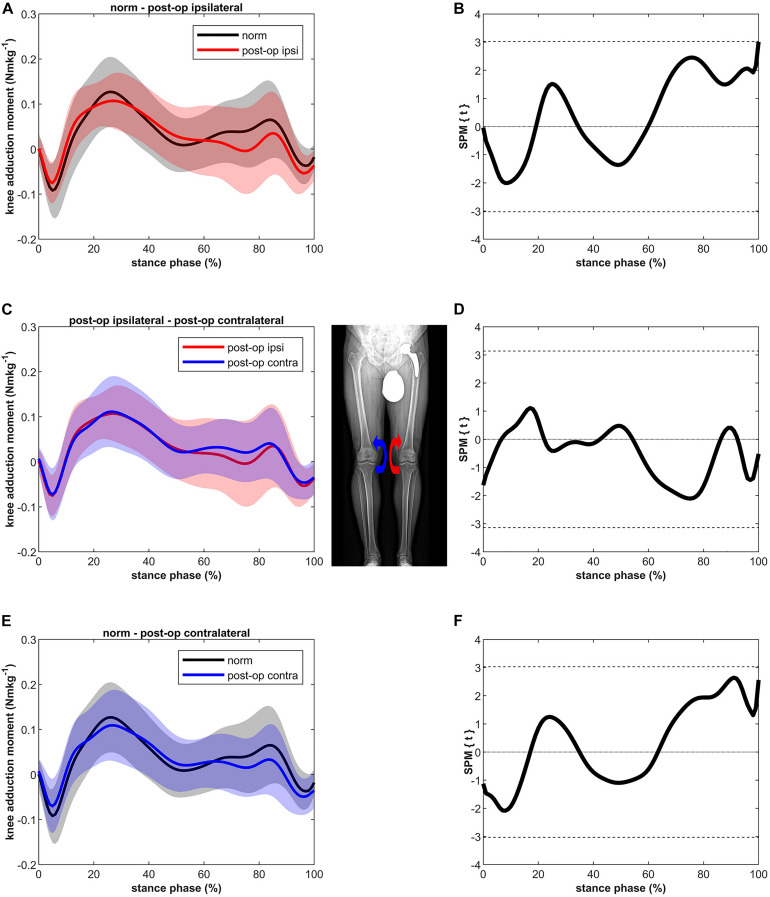
FIGURE 2.
Curves of the external knee adduction moment (bands represent standard deviation) on the left side and the SPM t-test results on the right side; comparing controls (norm in black) to ipsilateral side of postoperative patients (post-op ipsi in red) at the top (A,B), ipsilateral side of postoperative patients (post-op ipsi in red) to the contralateral side (post-op contra in blue) in the middle (C,D) and controls (norm in black) to the contralateral side of the postoperative patients (post-op contra in blue) at the bottom (E,F). When the SPM t-values exceed the critical threshold (dashed horizontal line), differences are significant. Where significant differences are found for more than 4 successive time points (4% of the stance phase of the gait cycle), areas are shaded gray and p-values are reported. The knee adduction moments are normalized to body mass and expressed in Nmkg–1.

