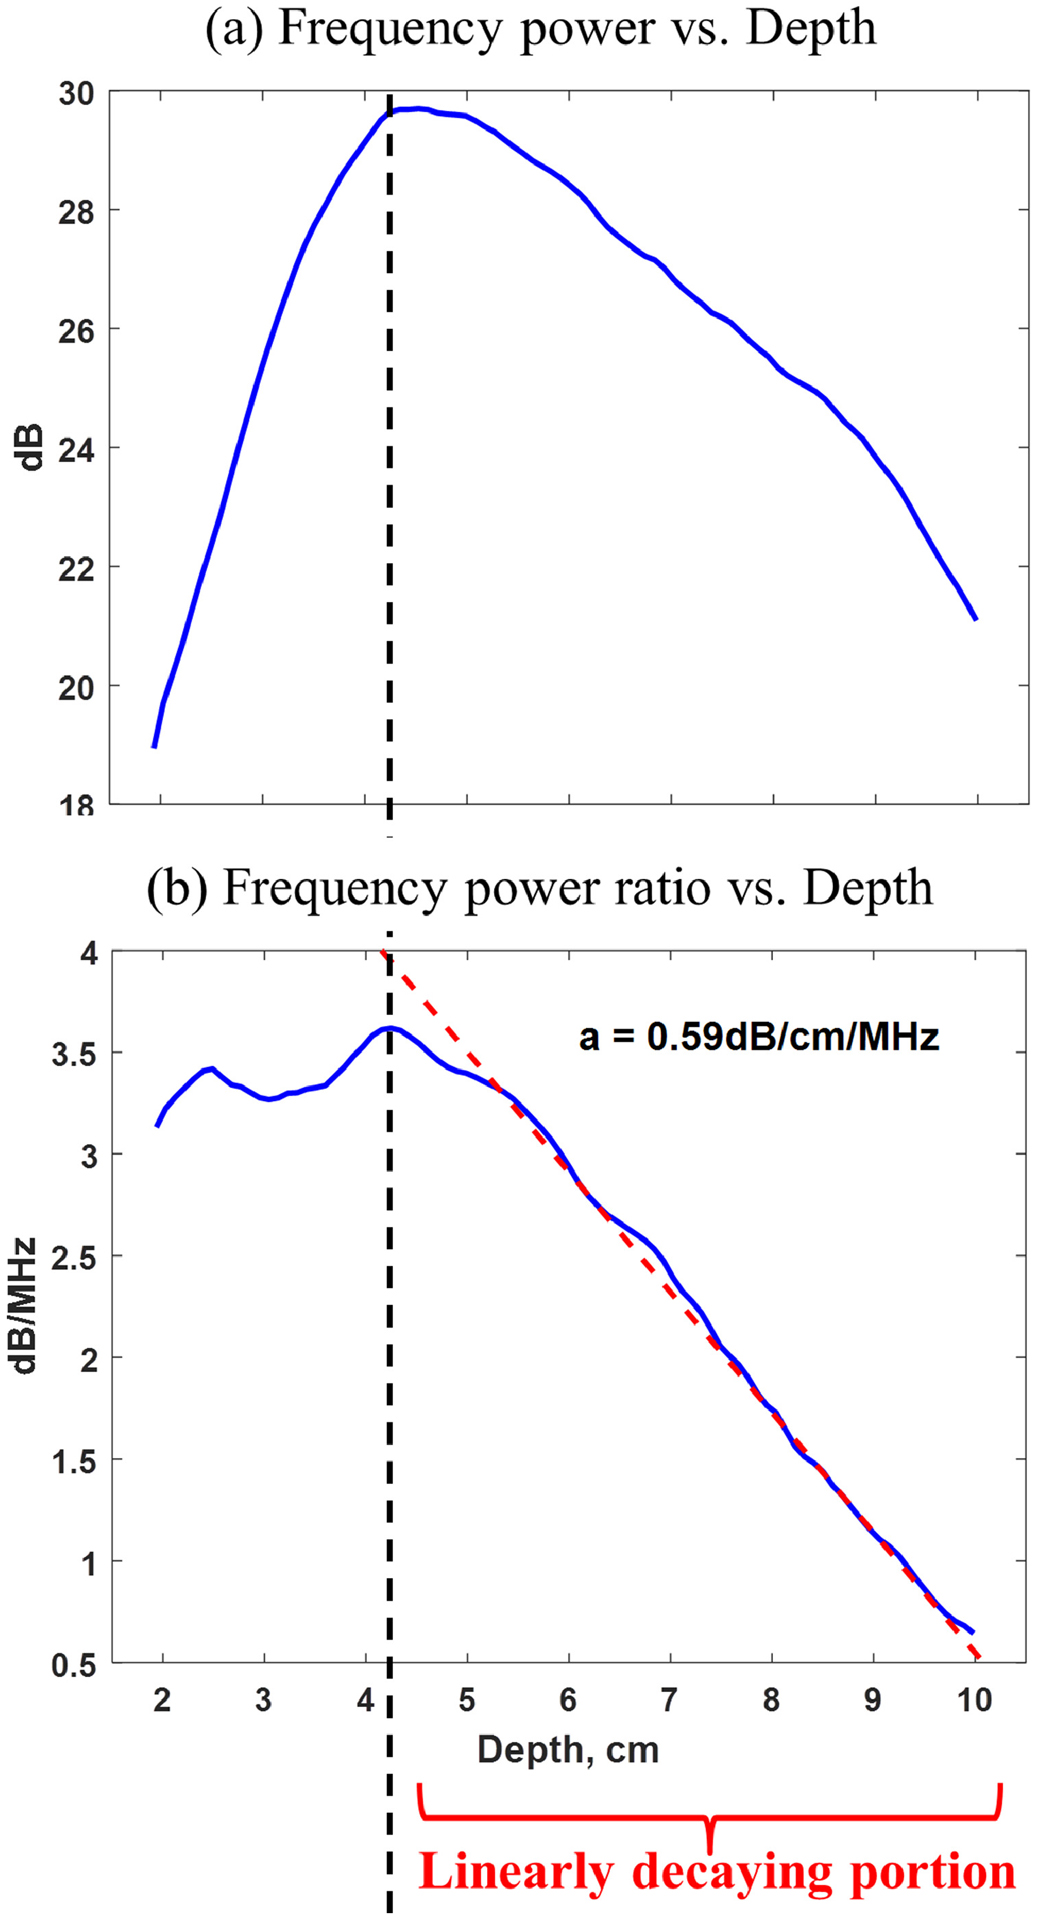
Figure 1.

(a) Mean frequency power curve versus depth; (b) Mean frequency power ratio curve versus depth. Linear regression was applied at larger depth of the mean frequency power ratio curve (i.e., 4–10 cm) and an attenuation coefficient of 0.59 dB/cm/MHz was estimated from the decay slope.
