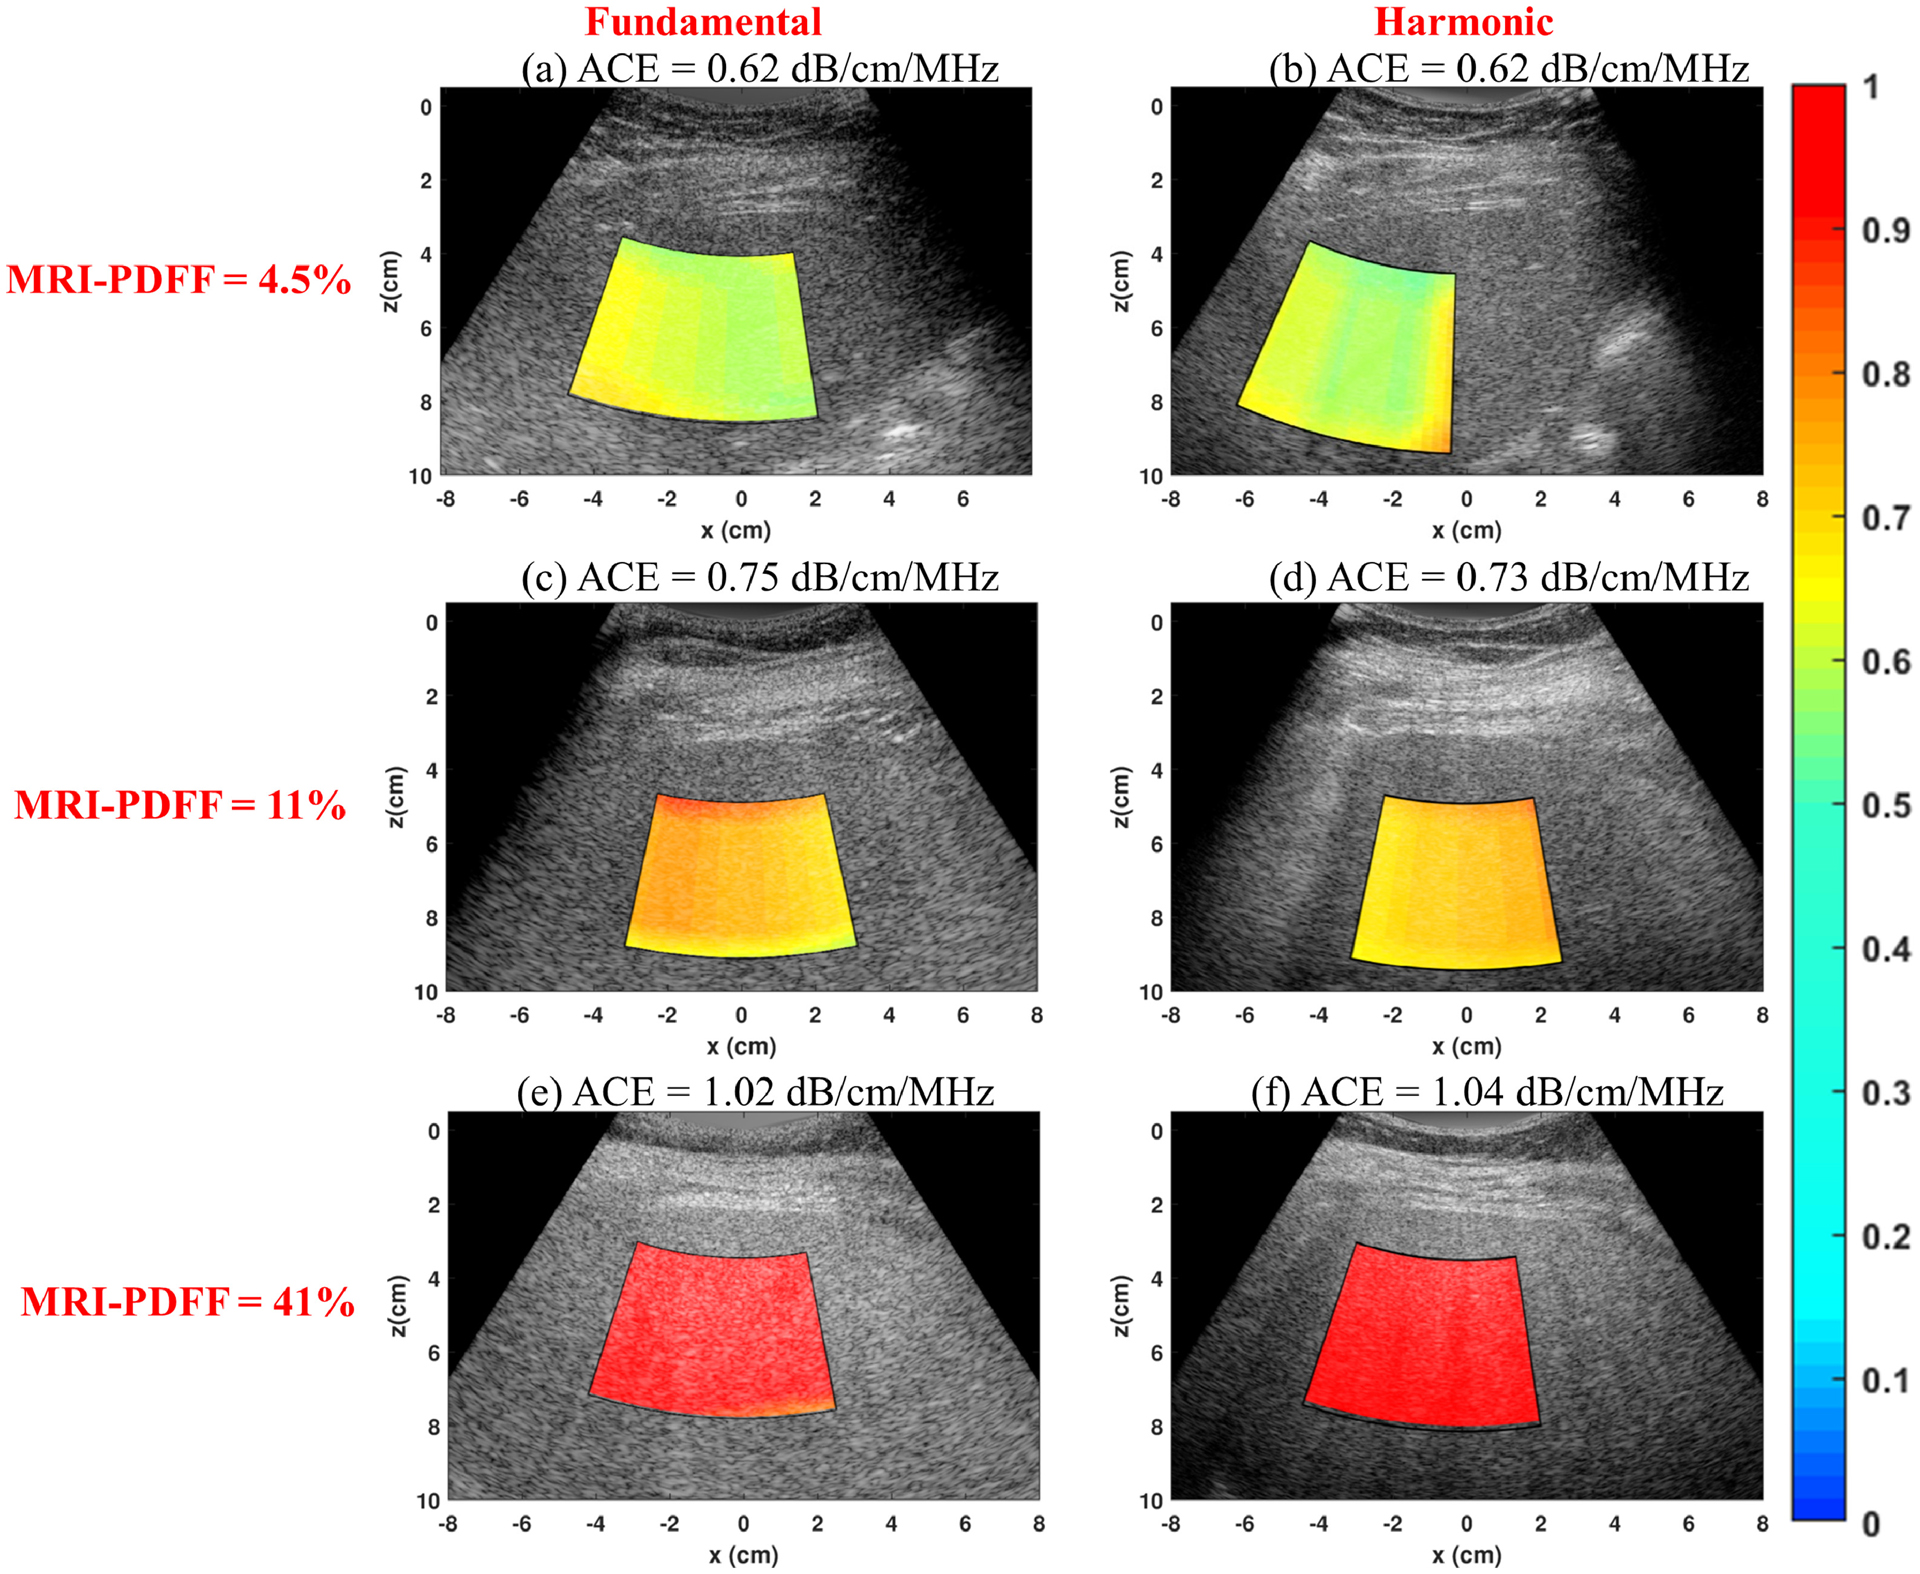
Figure 2.

Representative 2D attenuation coefficient maps acquired under both fundamental and harmonic imaging modes from three patients with different proton density fat fraction (PDFF). (a) Fundamental Reference Frequency Method (RFM) image acquired from a patient with PDFF of 4.5%; (b) Harmonic RFM image acquired from a patient with PDFF of 4.5%; (c) Fundamental RFM image acquired from a patient with PDFF of 11%; (d) Harmonic RFM image acquired from a patient with PDFF of 11%; (e) Fundamental RFM image acquired from a patient with PDFF of 41%; (f) Harmonic RFM image acquired from a patient with PDFF of 41%.
