Figure 2.
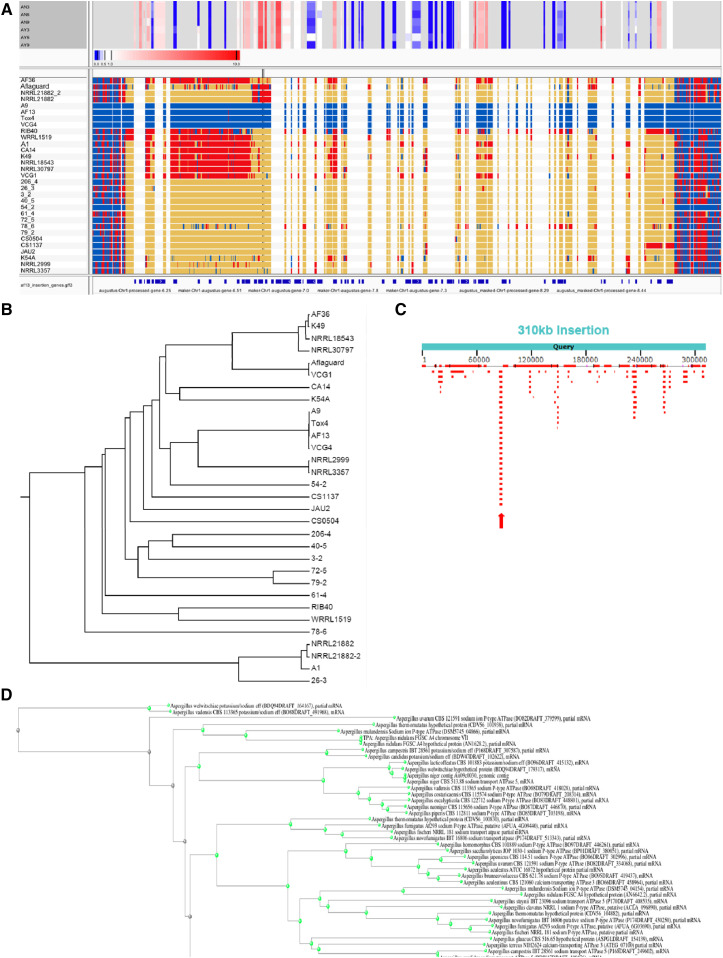
Variation in the 310Kb insertion gives insights into its origins and distribution within the species Aspergillus flavus. A. SNP calls within the insertion were evaluated. In the SNP plot, blue – AF13 calls; red – Non-AF13 calls; and yellow – no calls. The bounds of the insertion are visually apparent as an extended row of yellow (‘no call’) in strains lacking the insertion. Above the SNP calls, gene expression levels are displayed in the heatmap with box size corresponding to the position of each annotated gene in the insertion. Transcript expression levels for the annotated genes within the insertion in AF13 in response to oxidative stress over time (0 – 9 hr) are indicated above the SNP plots according to the inset scale. The positions of annotated genes within the insertion can be seen in the lowermost track below the SNP plots. Partial insertions can be observed in several biological control isolates. B. Neighbor-joining tree based on genome-wide SNP calls. AF13 and related isolates appear polyphyletic to the other A. flavus isolates. C. A single conserved gene, a Na ATPase, was identified in the insertion shown by BLAST hit alignments relative to the insertion (note the stacked hits for this gene indicated by the red arrow). D. Hits from related Aspergillus species were used to build a neighbor-joining tree. Maximum homology was only 84.35%, and the tree suggests that the insertion may be ancestral to the speciation of A. flavus and A. oryzae.

