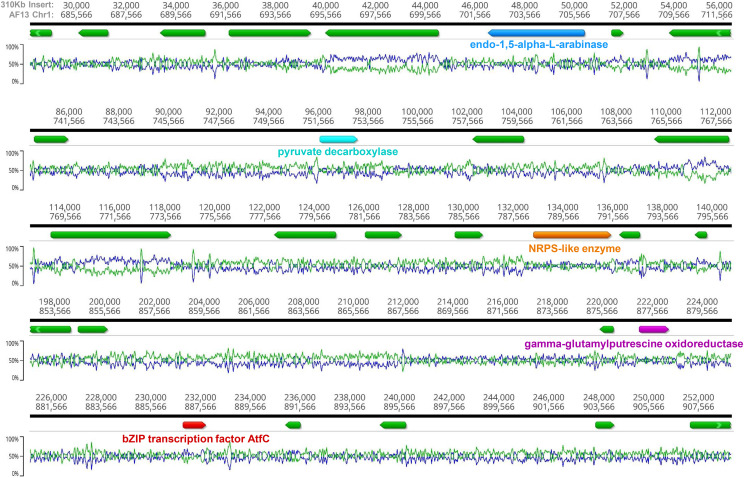
Figure 4.
Composition and unique genes contained within the 310Kb insertion identified on Chromosome 1 of AF13. This plot of some select regions of the insertion contains colored arrows indicating genes of interest within the insertion. Relative position within the insertion and AF13 Chromosome1 are listed on the top of the plot. The line graphs show G/C (blue) and A/T (green) content along the sequence. A novel bZIP transcription factor, annotated here atfC, can be seen in red.

