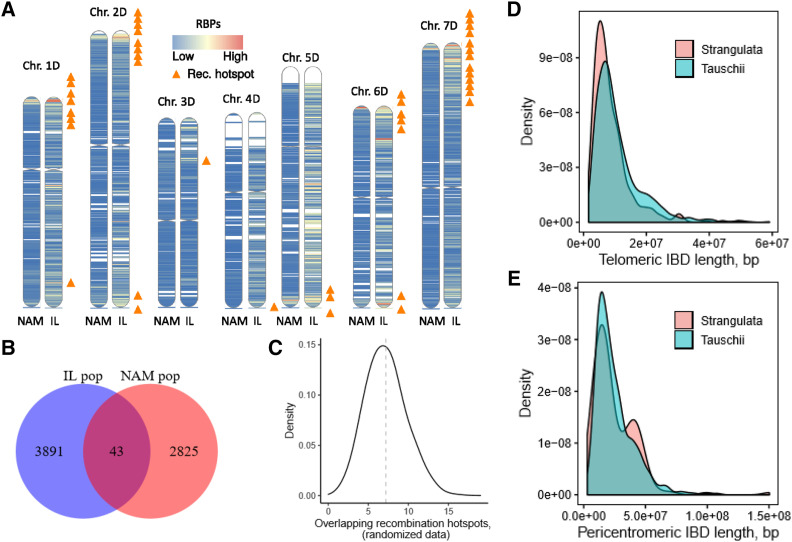
Figure 4.
Effect of chromosome physical location on recombination rate and introgression. (a) A comparison of normalized recombination rate in 2 Mbp windows between nested association mapping (NAM) (Jordan et al. 2018) and Ae. tauschii introgression (IL) populations. The orange triangles show the overlapping windows with high recombination rate in the two populations at 95th percentile. (b) A venn diagram showing the total number of 2 Mbp windows with at least one recombination event across the NAM and IL population while the intersection represents the overlaps at 95th percentile. (c) Distribution of 2 Mbp window recombination hotspots permutation overlaps between the two populations. (d) Distribution of the introgressed segment’s length from Ae. tauschii ssp. strangulata and Ae. tauschii ssp. tauschii in the distal regions of the chromosomes. (e) Distribution of the introgressed segment’s length from Ae. tauschii ssp. strangulata and Ae. tauschii ssp. tauschii in the 2/3 pericentromeric regions of the chromosomes.

