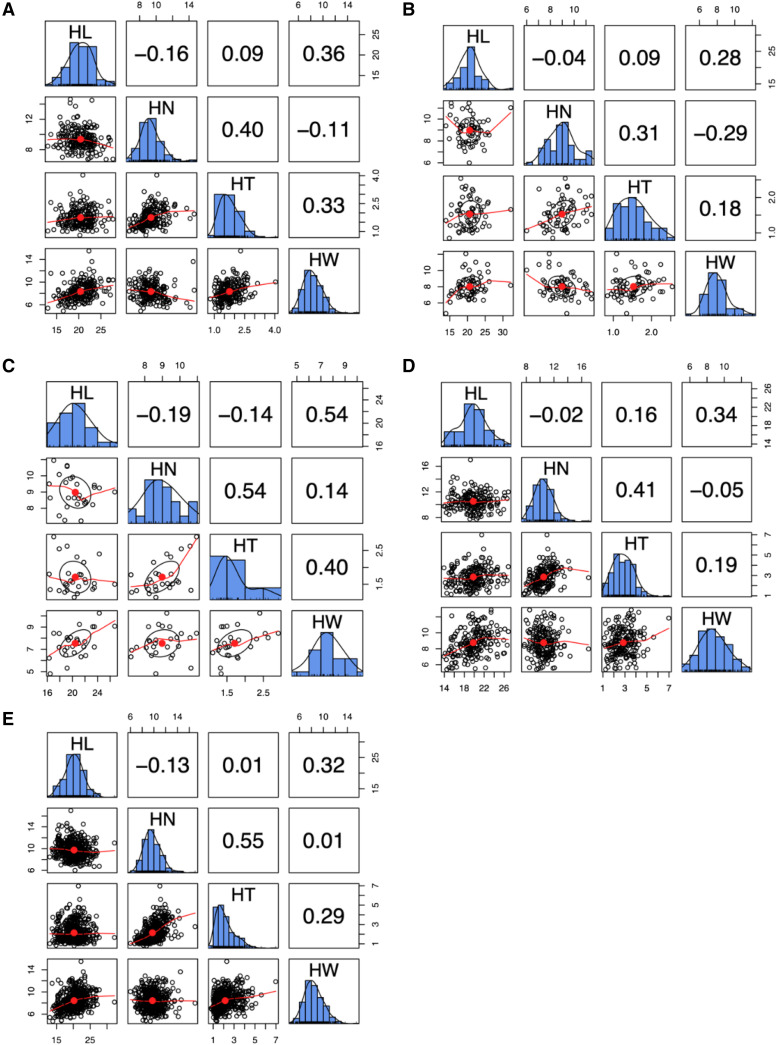
Figure 1.
Phenotypic correlation and frequency distributions of four husk traits in different subpopulations. (A) Admixed (MIXED) subpopulation. (B) Non-stiff stalk (NSS) subpopulation. (C) Stiff stalk (SS) subpopulation. (D) Tropical-subtropical (TST) subpopulation. (E) Whole association panel. The husk traits are husk length (HL), husk layer number (HN), husk thickness (HT), and husk width (HW). The unit of measure is cm for HL, HT, and HW.The plots on the diagonal line exhibit the phenotypic distribution of the mean value for each husk trait. Displayed below the diagonal line, are the scatter plots for mean value of each two husk traits; displayed above the diagonal line are Pearson correlation coefficients. The red line and red dot represent the lowest regression fitting curve and the correlation ellipse, respectively.

