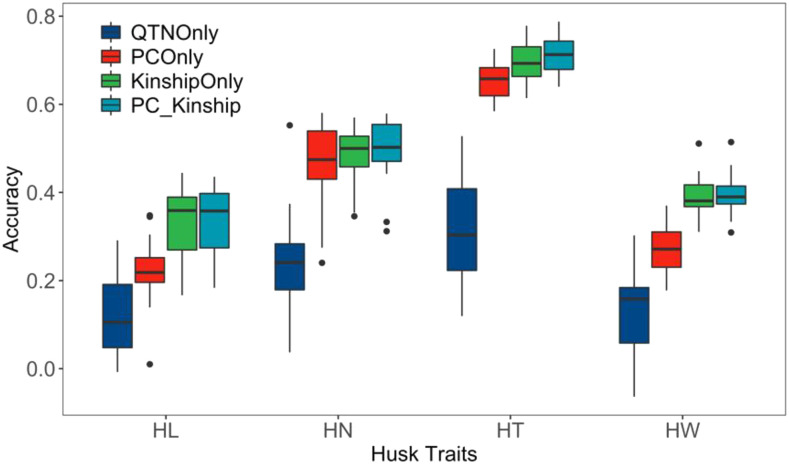
Figure 3.
Comparison among four models to predict four husk traits. The comparisons were conducted in a population with 498 maize inbred lines by randomly sampling 20% of whole population as testing population and the rest as training population. The sampling was conducted 20 times. The models include 1) MAS using the top ten associated markers (QTNs) only; 2) Using PCs only; 3) Using kinship only; and 4) Using both PCs and kinship.

