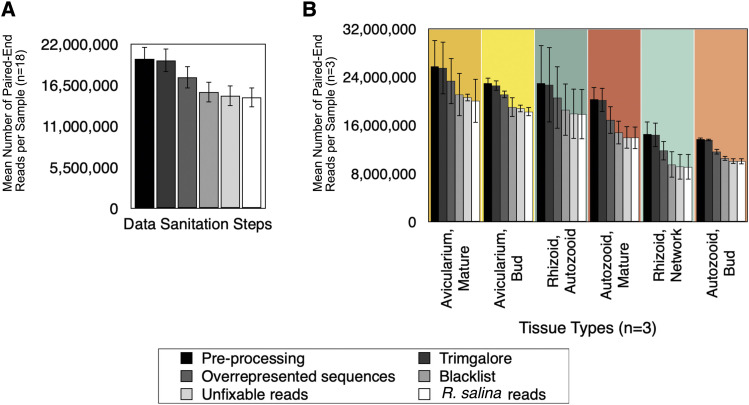
Figure 3.
Sanitization of bryozoan sequences. Mean (± SE) number of paired-end reads is plotted for A) all samples pooled together (n = 18) and for B) individual samples (n = 3). Each sample went through four steps of filtering: removing adapter contamination and low-quality reads (Trimgalore), removing overrepresented sequences (as identified by FastQC), removing any reads that mapped to a bacterial, archaean, and eukaryotic ribosomal RNA databases (SILVA small subunit (SSU) and large subunit (LSU) “Parc” databases) along with all bryozoan rRNA and R. salina sequences from GenBank (accessed July 7, 2017), removing any reads with sequencing errors that were deemed ‘uncorrectable’ (Rcorrector), and removing any reads that mapped to the R. salina transcriptome.

