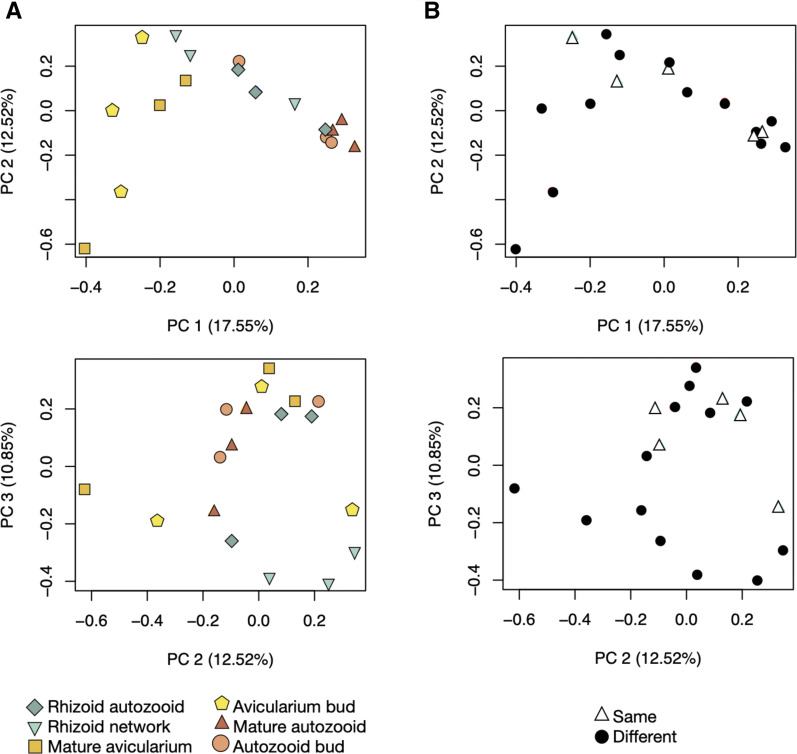
Figure 8.
Reference transcriptome sample relationships. Principal components analysis (plotted as PC1 vs. PC2 and PC2 vs. PC3) of each sample in the log2 gene count matrix of the reference transcriptome assembly. A) Samples are labeled by tissue type and developmental stage. B) Samples are labeled by genetic individual, where samples labeled ‘Different’ originate from genetically distinct colonies and samples labeled ‘Same’ represent tissue samples of different zooid type and stage that originated from the same genetic individual.

