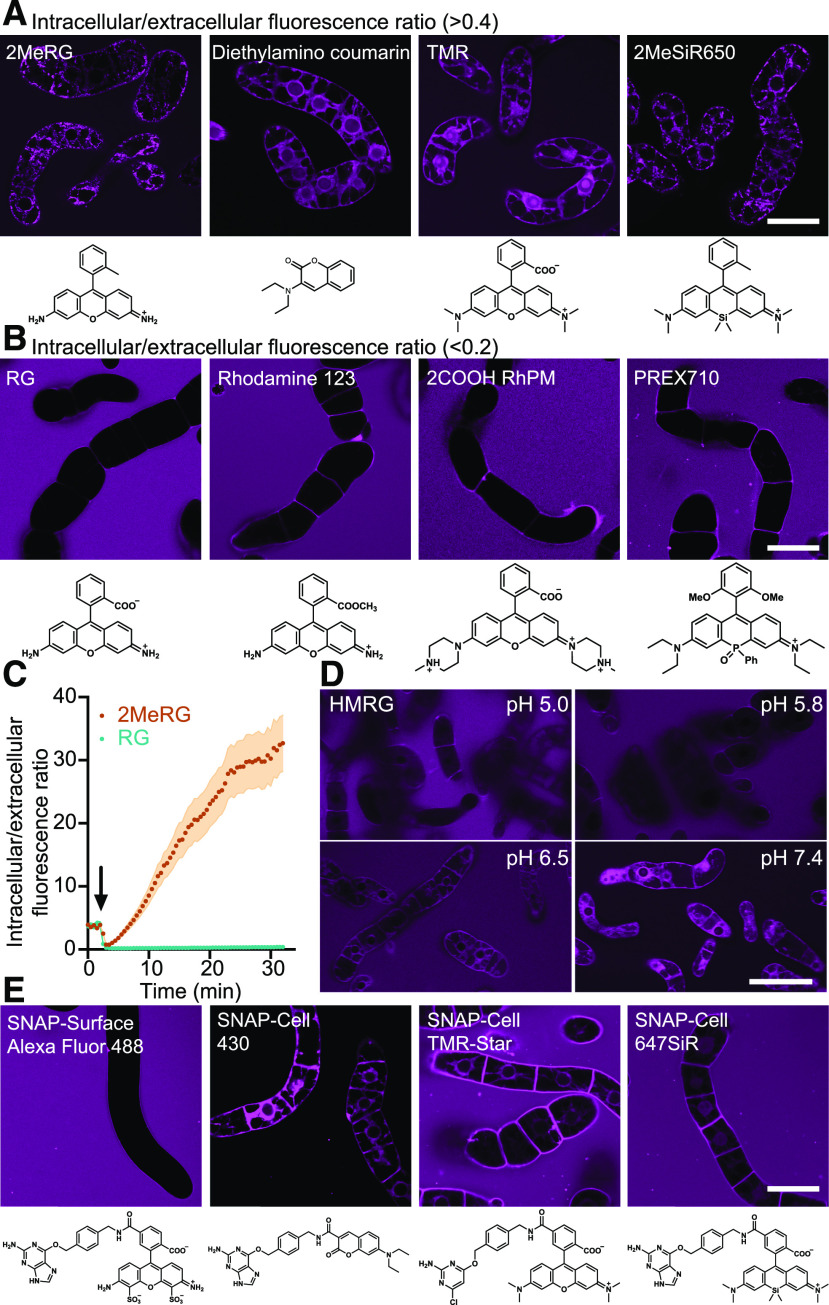
Figure 1.
Representative Images of BY-2 Cells Exposed to Various Fluorescent Dyes under Various Conditions.
(A) Representative images of four dyes that entered BY-2 cells within 1 min. Permeability was calculated as the ratio of fluorescence intensity inside/outside the cell. An intracellular/extracellular fluorescence intensity ratio of >0.4 indicated uptake.
(B) Representative data for three dyes unable to enter BY-2 cells. Intracellular/extracellular fluorescence intensity ratios were <0.2.
(C) Time-lapse analysis of 2MeRG and RG accumulation, measured by intracellular/extracellular signal ratios. Plots and error bands represent mean (n = 6 cells) and se, respectively. Arrow indicates when dyes were added. Initial positive ratio is in absence of dye and due to autofluorescence.
(D) HMRG uptake at different pH values.
(E) Confocal images of BY-2 cells incubated with SNAP-Surface Alexa Fluor 488, SNAP-Cell 430, SNAP-Cell TMR-Star, and SNAP-Cell 647SiR for 1 min. Images were taken with same settings at different time points. Bars = 50 µm. Experiments were repeated independently three times with comparable results.

