
Figure 1.
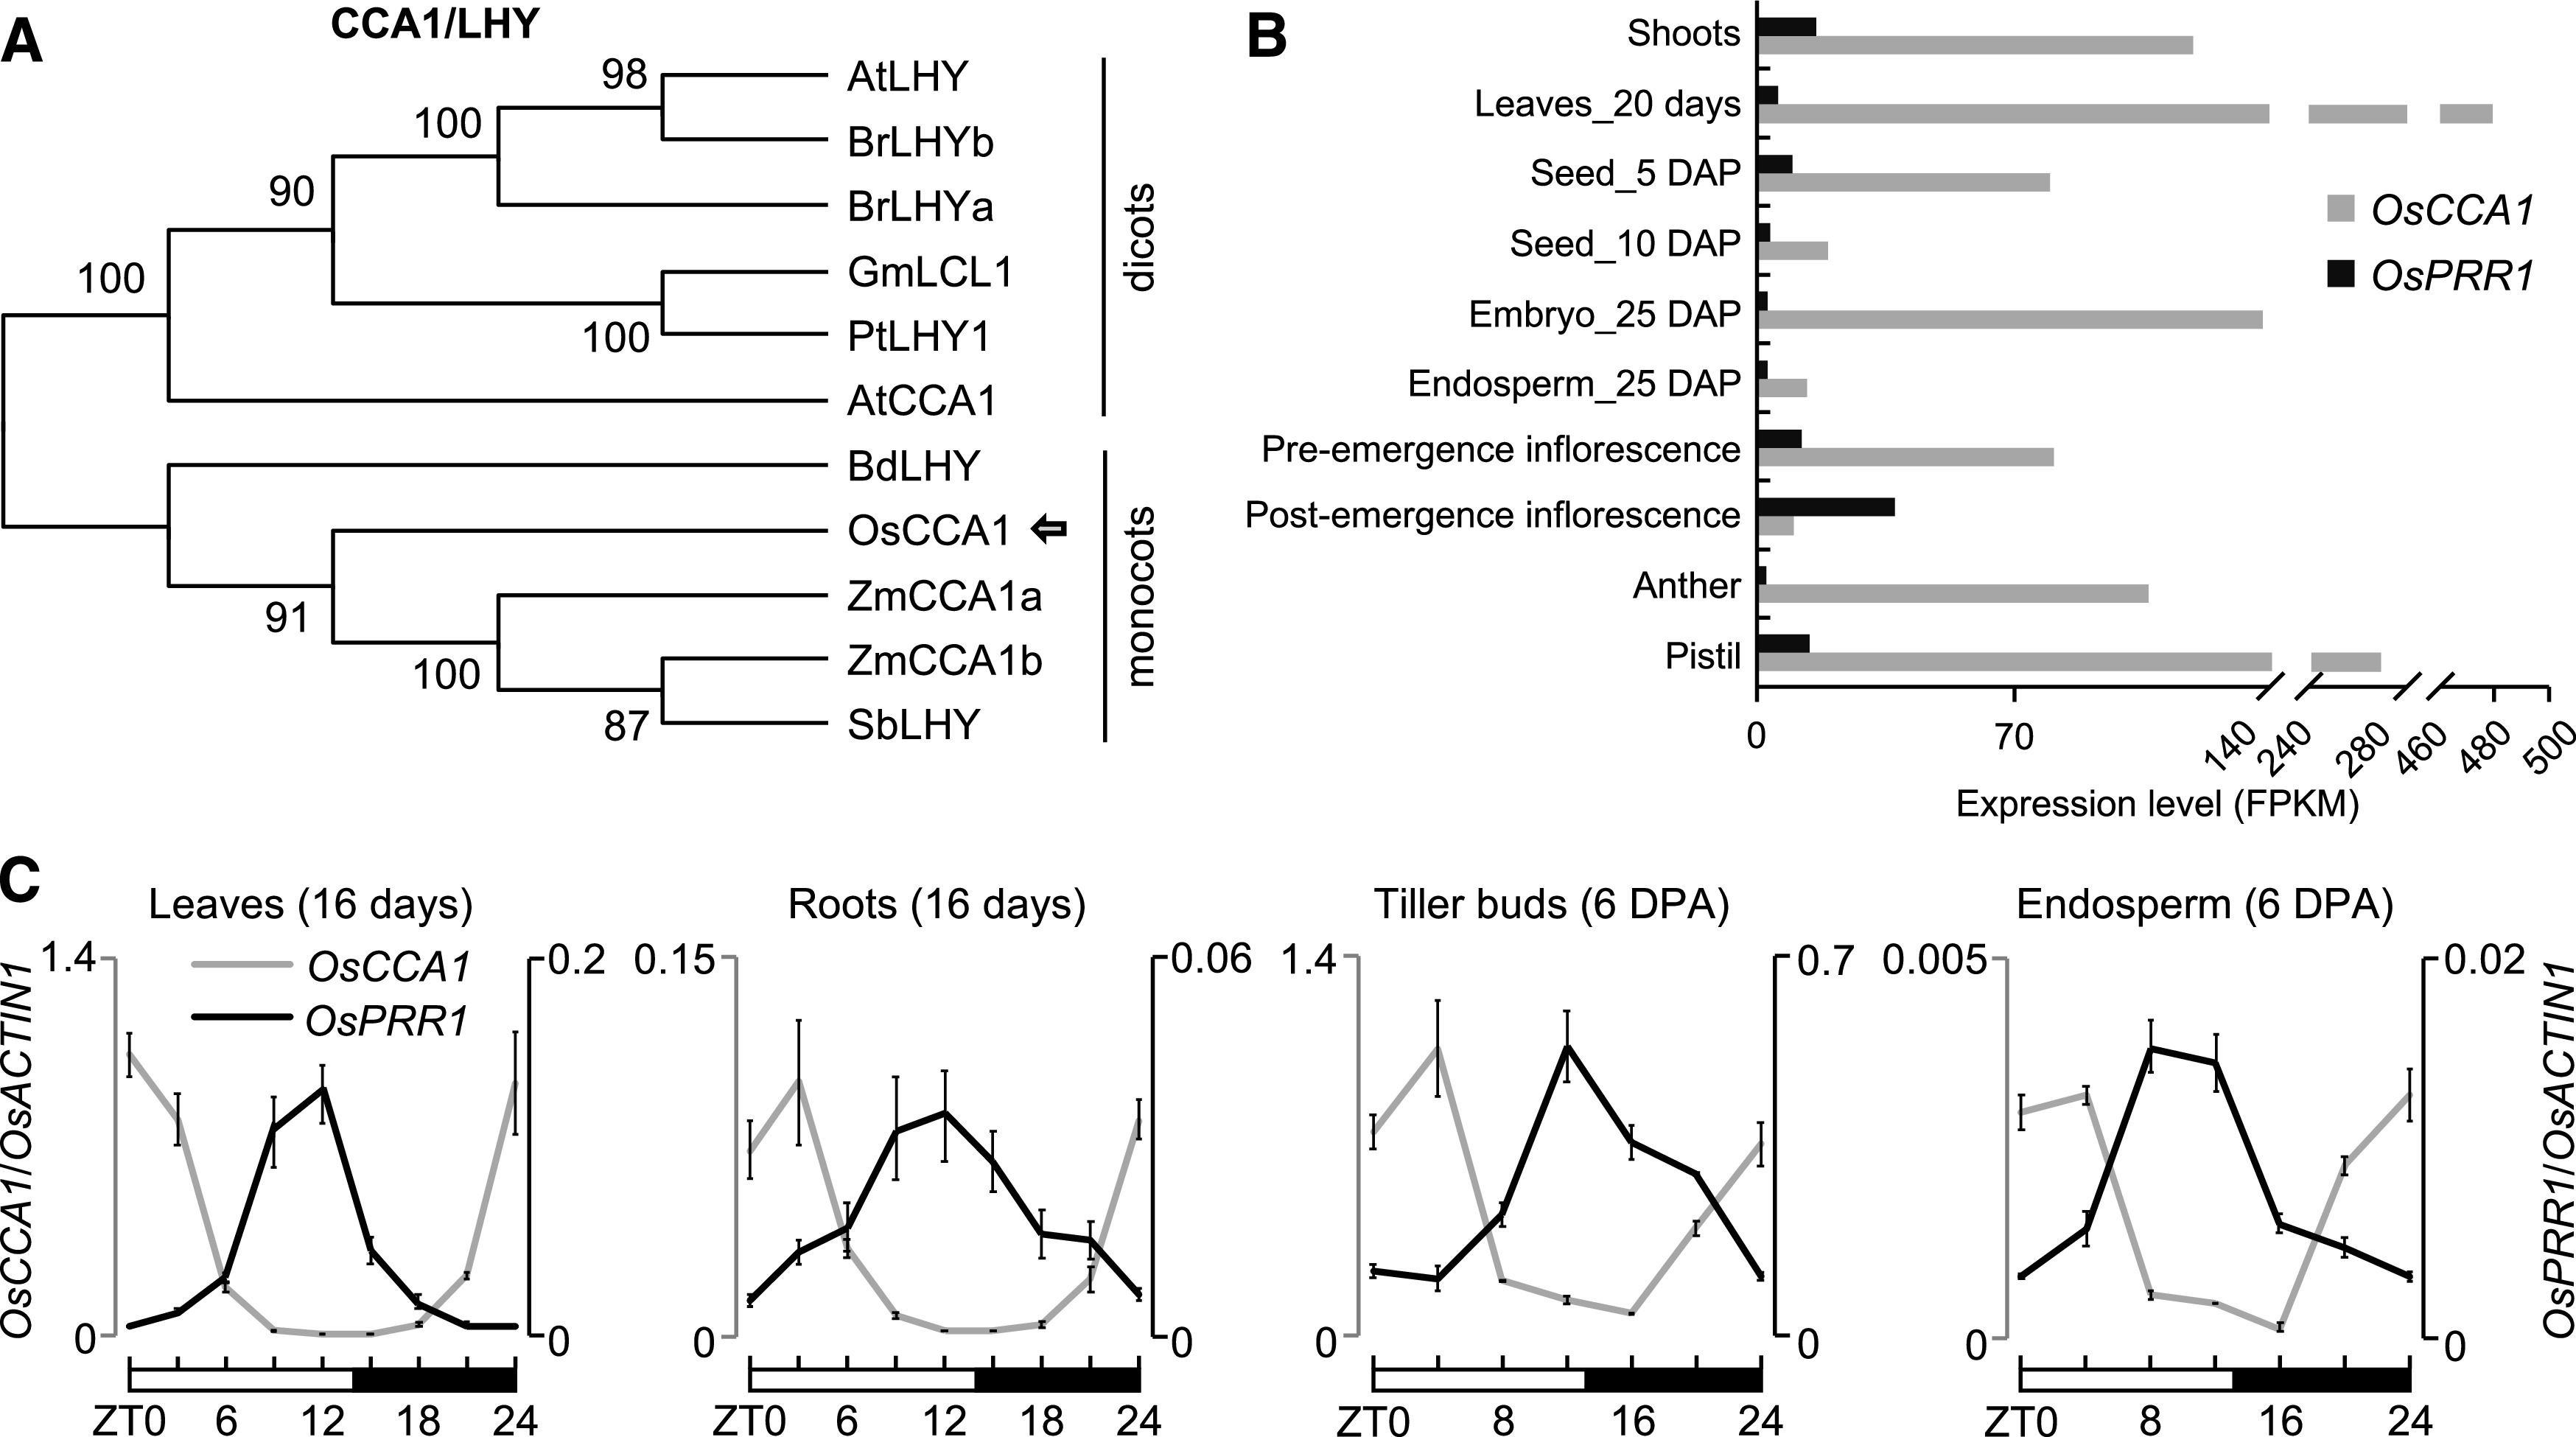
Expression Patterns of OsCCA1 and OsPRR1.
(A) Phylogenetic analysis of CCA1/LHY amino acid sequences. The tree was constructed by the neighbor-joining method, and bootstrap values (1,000 replicates) are shown next to the relevant branches. Os, O. sativa; Zm, Z. mays; Sb, S. bicolor; Bd, B. distachyon; At, A. thaliana; Br, B. rapa; Gm, G. max; Pt, P. trichocarpa.
(B) Expression levels of OsCCA1 and OsPRR1 in different tissues of ‘Nipponbare’. Rice RNA-seq data (Sakai et al., 2013) were used to compare the tissue-specific expression for OsCCA1 and OsPRR1. Expression levels indicate fragments per kilobase of exon model per million fragments mapped (FPKM). DAP, days after pollination.
(C) RT-qPCR analysis of OsCCA1 (left, gray) and OsPRR1 (right, black) transcript levels (OsACTIN1 as the internal control) in different tissues (mean ± sd; n = 3 biological replicates, unless noted otherwise). The expression levels of OsCCA1 and OsPRR1 in different tissues were normalized to OsCCA1 at ZT0 in leaves. Leaves and roots were harvested every 3 h in a 24-h period from the growth chamber. Tiller buds and endosperms were harvested every 4 h in field conditions. The white and black bars represent light and dark conditions, respectively. ZT0 = dawn. DPA, days post anthesis.