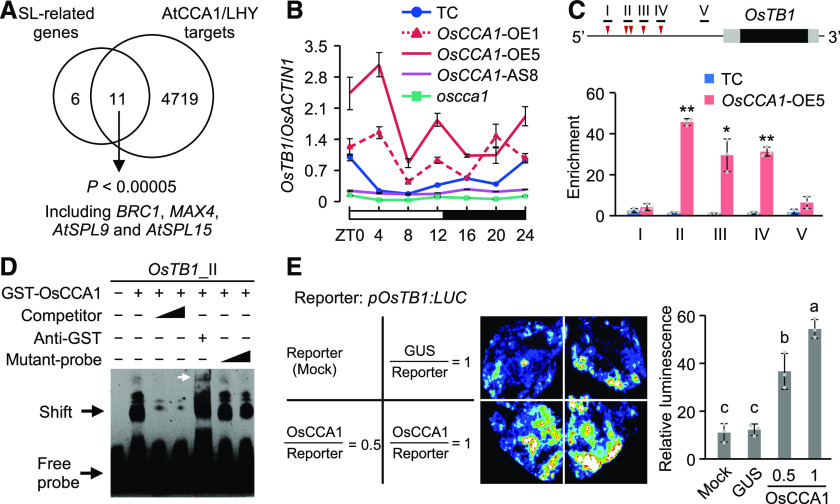
Figure 3.
OsCCA1 Directly Binds to the OsTB1 Promoter and Activates its Expression.
(A) Enrichment of AtCCA1/LHY target genes (Nagel et al., 2015; Kamioka et al., 2016) in Arabidopsis SL-related genes (P < 0.00005, Fisher’s exact test). BRC1 and MAX4 are homologous to rice OsTB1 and D10, respectively; AtSPL9 and AtSPL15 are two homologous genes of IPA1.
(B) RT-qPCR analysis of OsTB1 transcript levels in the TC, OsCCA1-OE, and OsCCA1-AS lines and in the oscca1 mutant (mean ± sd; n = 3 biological replicates, unless noted otherwise). The white and black bars represent light and dark conditions, respectively (ZT0 = dawn).
(C) Diagram of the OsTB1 promoter region (2-kb upstream) shows locations of CBS (red arrowhead) and fragments (black bar) used in ChIP. The black and gray boxes represent the coding regions and 5′ and 3′ UTRs, respectively. ChIP-qPCR analysis of OsTB1 promoter fragments in tiller buds of TC and OsCCA1-OE5 plants (mean ± sd; n = 3 biological replicates, unless noted otherwise). ChIP was conducted with antibodies specific for GUS or non-specific IgG as a Ctrl. Single and double asterisks indicate statistical significance levels of P < 0.05 and P < 0.01, respectively (Student’s t test).
(D) Recombinant GST-OsCCA1 protein bound directly to OsTB1 promoter in EMSA. Unlabeled (competitor) or mutated (mutant-probe) probes (100× and 500× excess) were used in competition assays. The white arrow indicates a super-shift band.
(E) Luciferase luminescence images (left) and relative intensities (right) show activation of the pOsTB1:LUC reporter gene. pOsTB1:LUC was co-transfected with 35S:GUS or 35S:OsCCA1-GUS into N. benthamiana leaves (mean ± sd; n = 3 biological replicates). Different letters at the top of each column indicate statistical significance at P < 0.01 (Tukey’s test).

