Figure 4.
OsCCA1 Affects the SL Pathway and Acts Upstream of OsTB1 and D14.
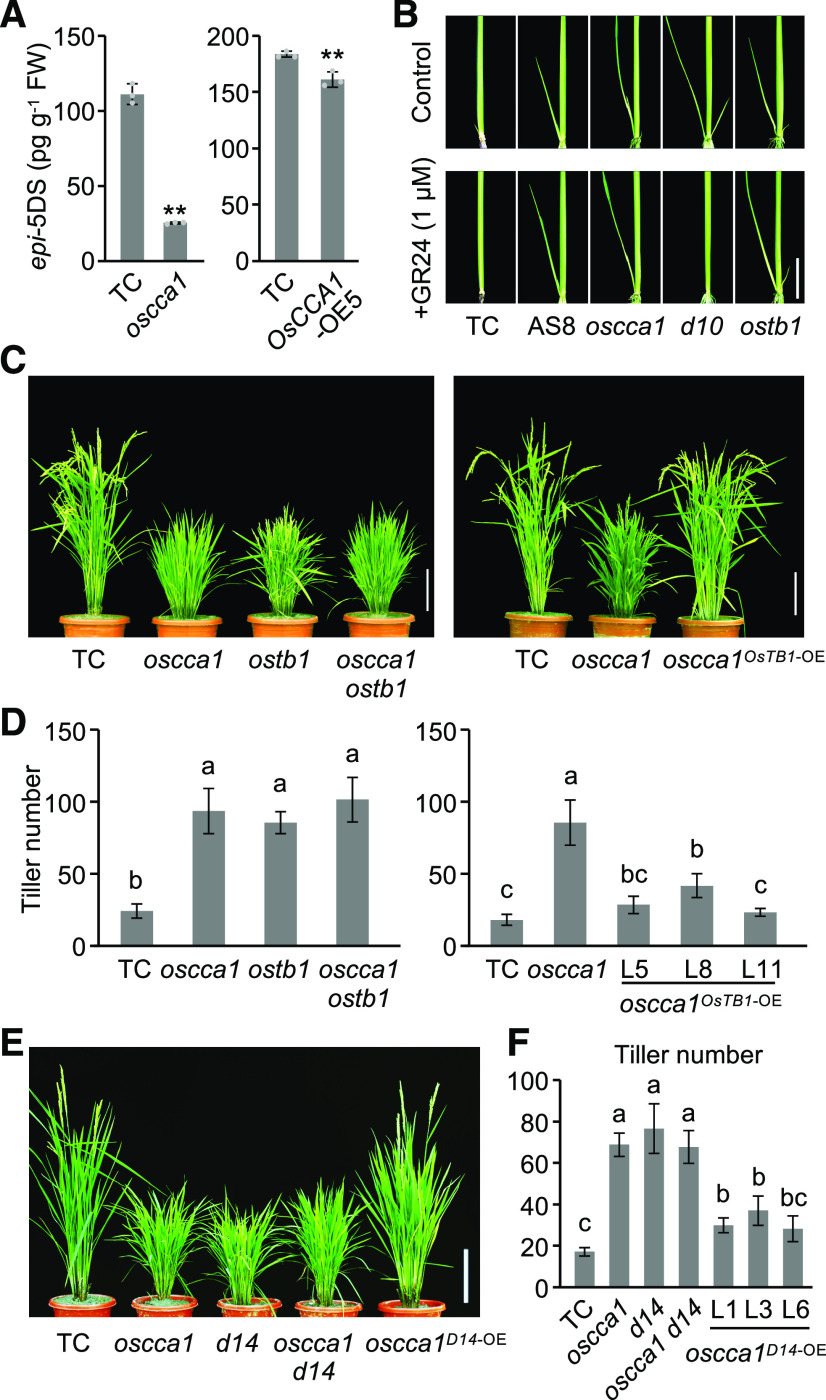
(A) epi-5DS levels in root exudates of TC, OsCCA1-OE5 and oscca1 mutant seedlings (3-week–old; mean ± sd; n = 3 biological replicates). FW, fresh weight. Double asterisks indicate statistical significance level of P < 0.01 (Student’s t test).
(B) The OsCCA1-AS8 line, and the oscca1 and ostb1 mutants, were insensitive to GR24 (a synthetic SL analog). Scale bar = 2 cm.
(C) Tillering phenotype of the oscca1 ostb1 double mutant (left), and the high tillering phenotype of the oscca1 mutant was restored by OsTB1 overexpression (right). Scale bar = 20 cm.
(D) Tiller numbers of the oscca1 ostb1 double mutant and oscca1OsTB1-OE transgenic plants at the heading stage (mean ± sd; n = 10). Different letters above each column indicate statistical significance at P < 0.01 (Tukey’s test).
(E) Tillering phenotypes in TC, oscca1, and d14 single mutant, oscca1 d14 double mutant, and oscca1D14-OE transgenic plants. Scale bar = 20 cm.
(F) Tiller numbers of the lines in (E) (mean ± sd; n = 10). Different letters above each column indicate statistical significance at P < 0.01 (Tukey’s test).

