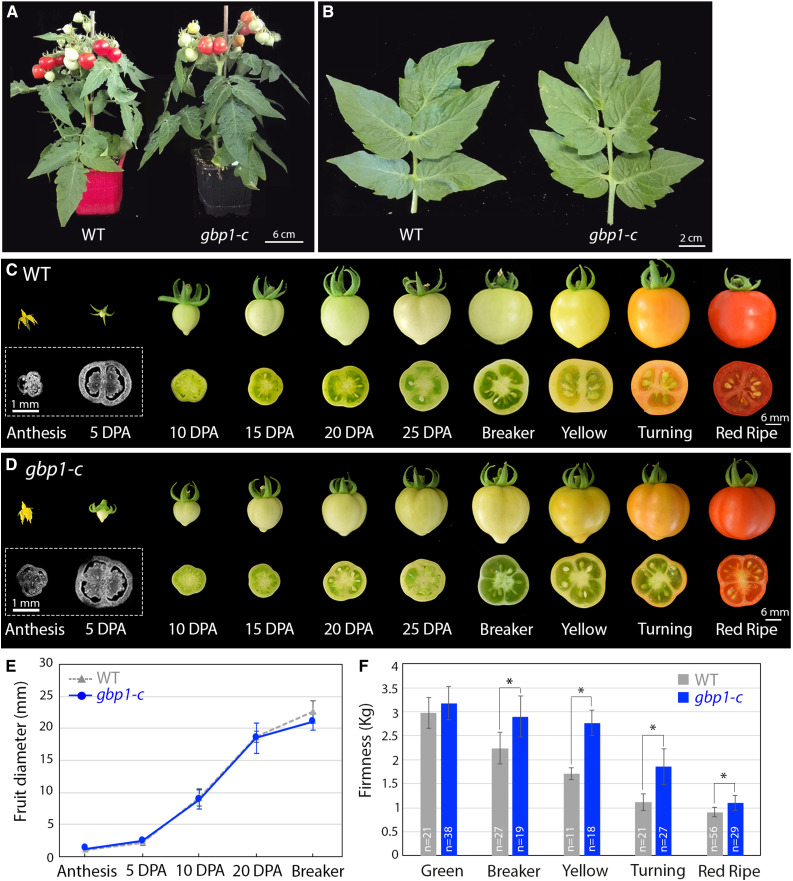
Figure 3.
Plant and Fruit Development in the Wild Type and gbp1-c.
(A) Plant phenotypes of the wild type (WT) and gbp1-c.
(B) Leaf phenotypes of the wild type and gbp1-c.
(C) and (D) Whole fruits and half transverse sections of the wild type (WT) and gbp1-c during fruit development. For anthesis and 5DPA, equatorial sections were stained with Calcofluor white.
(E) Fruit diameter during the growth period. Values represent means ± sd (n = 9 to 16 fruits). Mutant samples include gbp1c-8 and gbp1-c4 fruits.
(F) Fruit firmness along development in wild type and mutant. Values represent means ± sd (n = 11 to 56 fruits). Mutant samples include gbp1c-8, gbp1-c10, and gbp1-c4.
In (E) and (F), significant differences between the mutant and the wild type: Wilcoxon test, P-value < 0.05 with FC >1.2 and > 2 are indicated by * and **, respectively.

