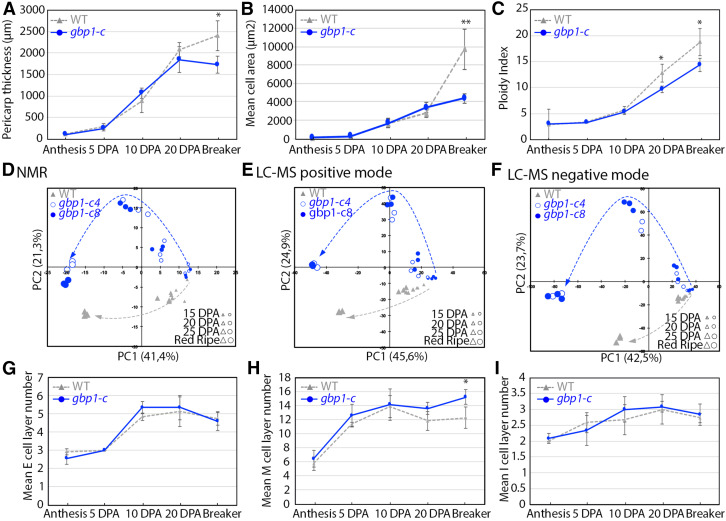
Figure 4.
Cellular Parameters and Composition during Pericarp Development.
(A) Pericarp thickness during pericarp development (n = 4 to 6 fruits).
(B) Mean cell area during pericarp development (n = 4 to 5 fruits).
(C) Ploidy index corresponding to the mean C-level of a pericarp cell (Bertin et al., 2009) during pericarp development (n = 5 to 8 fruits).
(D) to (F) Principal component analyses of metabolomics data in two independent gbp1-c lines and wild-type (WT) fruit. 1H-NMR data includes 329 spectra regions. LC-MS under positive ionization includes 1,523 metabolite features. LC-MS under negative ionization includes 3,915 metabolite features. Changes in the metabolic patterns along fruit development are represented by an arrow for each genotype.
(G) to (I) Exocarp (E), mesocarp (M), and endocarp (I) cell layer number during pericarp development (n = 3 to 6 fruits).
In (A) to (C) and (G) to (I), values represent means ± sd. Mutant samples include gbp1c-8 and gbp1-c4 fruits. Significant differences between the mutant and the wild type: Wilcoxon test, P-value < 0.05 with FC >1.2 and > 2 are indicated by * and **, respectively.

