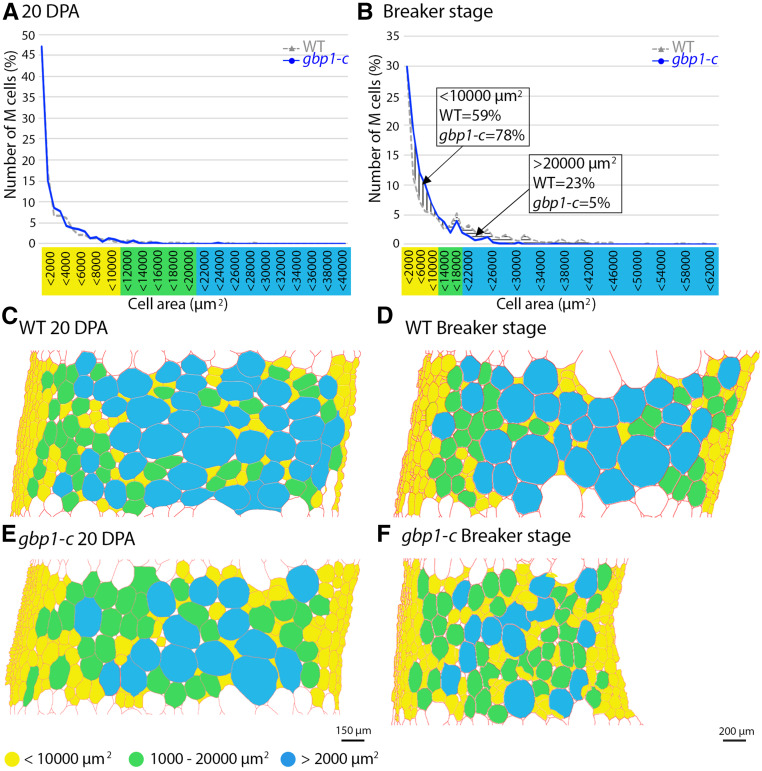
Figure 5.
Mesocarp Cell Area Distribution at 20 DPA and the Breaker Stage.
(A) and (B) Proportion (%) of mesocarp (M) cells in successive cell area categories in μm2. Values represent means of four wild-type and mutant (gbp1c-8 and gbp1-c4) fruits.
(C) to (F) Schematic representation of the spatial distribution of M cells in mutant and wild-type (WT) sections. Segmented cells walls obtained using the program CellSeT (Pound et al., 2012) are represented in red. A color code is given according to cell area.

