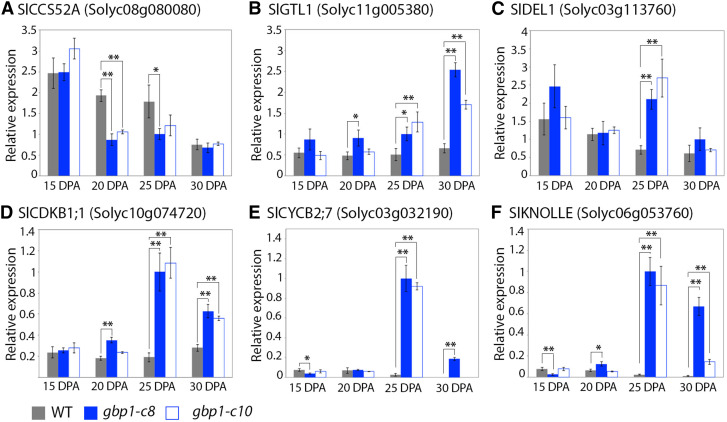
Figure 8.
Expression Patterns of Cell Cycle and Endocycle Regulators in the gbp1-c Mutant.
(A) SlCCS52A gene expression.
(B) SlGTL1 gene expression.
(C) SlDEL1 gene expression.
(D) SlCDKB1;1 gene expression.
(E) SlCYCB2;7 gene expression.
(F) SlKNOLLE gene expression.
Normalized relative expression of cell cycle genes in wild type (WT) and two gbp1-c mutant lines is given in arbitrary units. Values represent means ± sd for technical triplicates. Significant differences (Student's t test) between the mutants and the wild type are indicated by *P-value < 0.05 and **P-value < 0.01.

