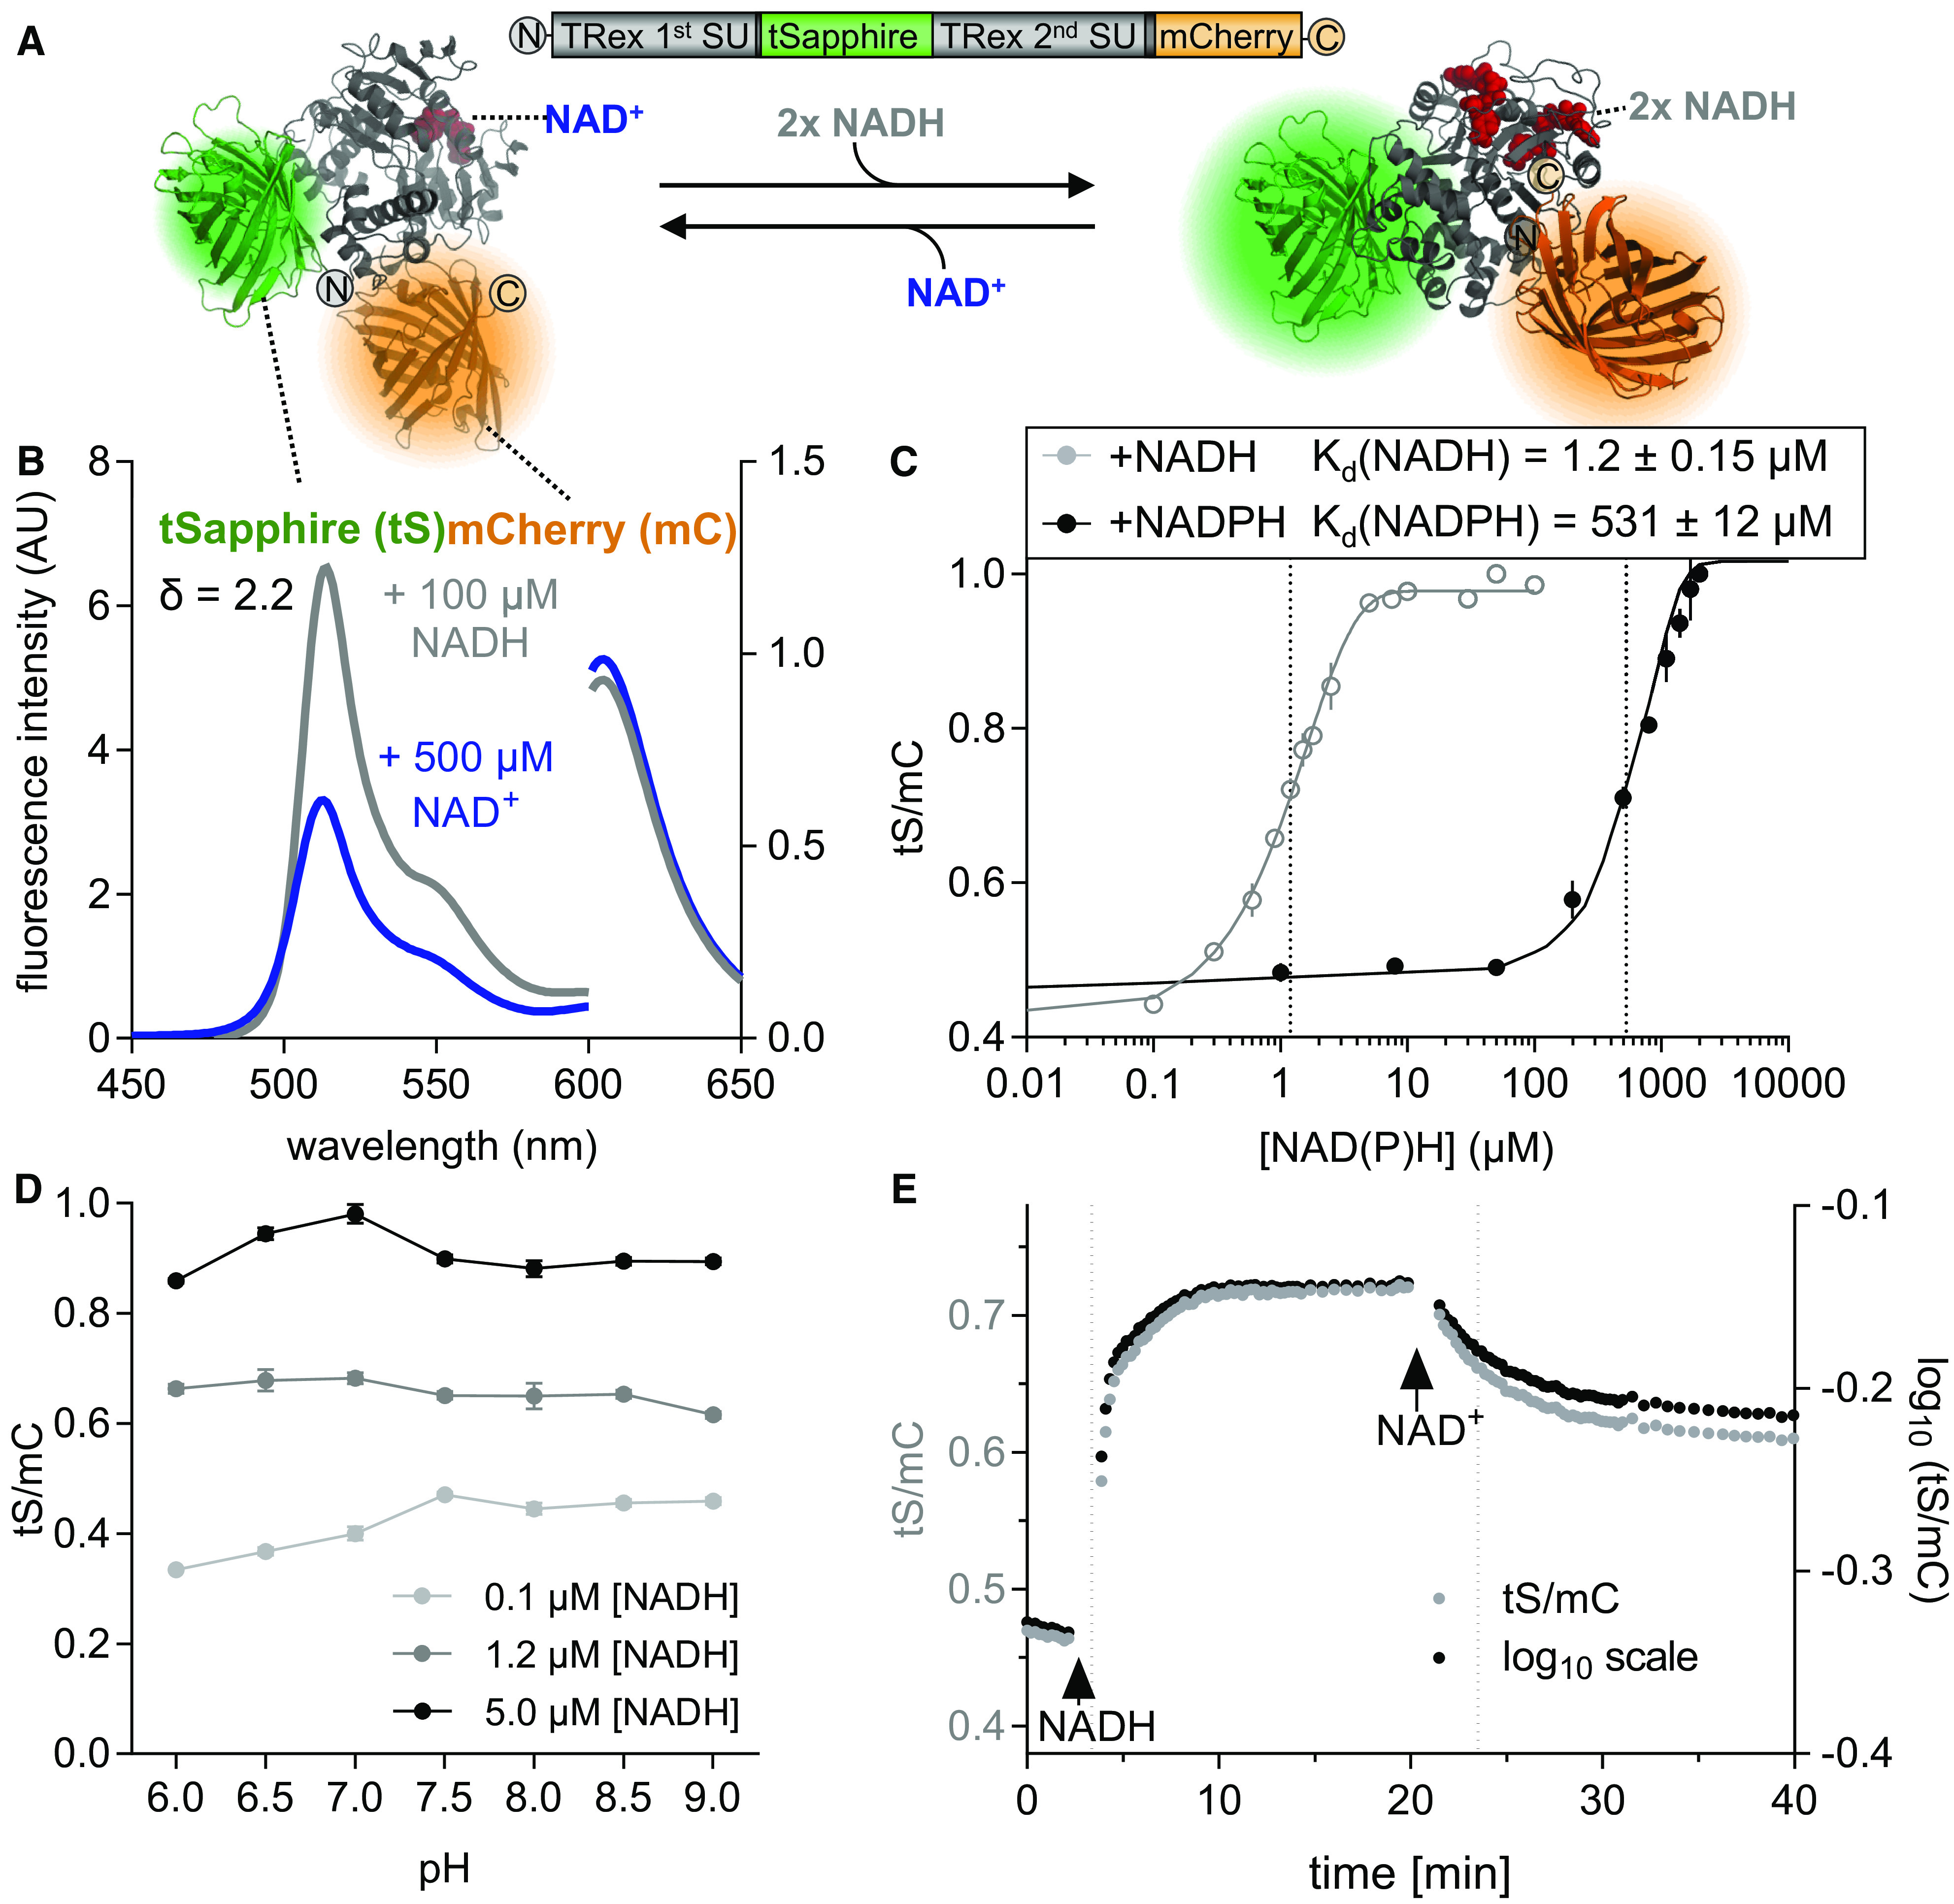
Figure 2.

Characteristics of Purified Recombinant Peredox-mCherry Protein.
(A) Hypothetical structural model of Peredox-mCherry. tS (Protein Data Bank [PDB]: 3evp, green) is interposed between two Rex subunits (SU; PDB: 2vt2 and 1xcb, gray). The binding of NADH (red, right) increases tS fluorescence, while NAD+ binding does not (red, left). tS signal is normalized by the mC (PDB: 2 h5q, orange) signal, which is unresponsive to NAD status. mC is fused to the C terminus of the second Rex domain.
(B) Emission spectra of tS (excitation at 400 ± 5 nm, left y axis) and mC (excitation at 580 ± 5 nm, right y axis) in arbitrary units (AU) × 103 after the addition of 500 μM NAD+ (blue) or 500 μM NAD+ plus 100 μM NADH (gray). The spectroscopic dynamic range (δ) was calculated from the tS/mC ratios at the respective emission maxima of the two fluorophores (tS, 513 ± 5 nm; mC, 610 ± 5 nm) for the NAD+-bound and NADH-bound sensor. Sensor protein concentration: 0.025 µg/μL in Tris-HCl, pH 7.5 (also for subsequent measurements unless otherwise stated).
(C) Ratiometric response of Peredox-mCherry to different NADH and NADPH concentrations in the presence of 500 µM NAD+ and 150 µM NADP+, respectively (n = 3, mean ± sd), pH 7.5. The ratio values were normalized to the highest ratio (set to 1) to allow comparison of NADH and NADPH binding (corresponding tS and mC spectra are presented in Supplemental Figures 3A to 3D). Data were fitted to a sigmoidal interpolation (Supplemental Data Set 1D). Dotted lines indicate Kd-values for NAD(P)H.
(D) Response of Peredox-mCherry to different pH values. Sensor protein was equilibrated with three different NADH concentrations (0.1, 1.2, and 5 µM) in the presence of 500 µM NAD+ to achieve low, mean, and high NADH/NAD+ binding at different pH values (6.0 to 9.0, n = 3, mean ± sd). The tS/mC fluorescence ratios were determined as in (C) at the indicated pH of the buffer (Bis-Tris for pH 6.0 to 7.0 and Tris-HCl for pH 7.5 to 9.0).
(E) NADH binding to and dissociation from Peredox-mCherry in vitro. Time resolved tS/mC (gray, left y axis) and corresponding log10-transformed ratio changes (black, right y axis) in response to NADH (1.2 µM, first arrow) in the presence of 500 μM NAD+ and to further NAD+ addition (500 µM, second arrow). Dotted lines indicate time to reach half of the response amplitude at NADH or NAD+ addition (linear regression analysis of log10-transformed ratios (one-phase decay fit; Supplemental Data Set 1E). Fluorescence emission was measured by multiwell plate reader–based fluorimetry in each well every 13 s. Excitation, 400 ± 10 nm (tS) and 570 ± 10 nm (mC); emission, 520 ± 5 nm (tS) and 610 ± 5 nm (mC). The assay was independently repeated three times with consistent results.
