Figure 5.
Dynamic Response of Cytosolic NAD Redox Status to Changes in Illumination, Respiratory Activity, and External Sugar Supply Using Multiwell Plate Reader–Based Fluorimetry.
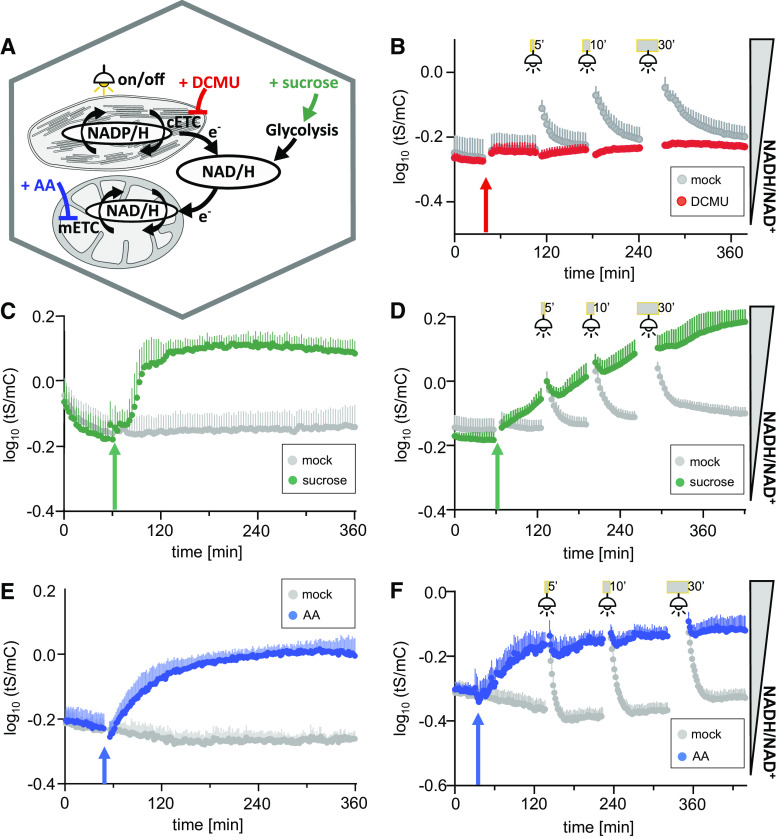
(A) to (F) Overview of the stimuli used to explore cytosolic NAD redox dynamics: illumination to activate photosynthesis including the chloroplastic electron transport chain (cETC) and cETC inhibition with photosystem II inhibitor DCMU (B), external Suc supplementation (C), inhibition of the mETC at complex III by AA (E), or combined stimuli (see [D] and [F]). Fluorescence emission was measured in each well, log10 transformed, and averaged sensor ratios were plotted after autofluorescence correction using Col-0 leaves.
(B) to (F) Time-course measurements of Peredox-mCherry ratio (log10(tS/mC)) of leaf discs from 5-week-old plants. Arrows indicate treatment and control treatment (mock) application after at least 90-min dark adaption. Excitation at 400 ± 10 nm (tS) and 570 ± 10 nm (mC), emission at 515 ± 7.5 nm (tS) and 610 ± 5 nm (mC). n ≥ 5, means + sd.
(B) Addition of 10 μM DCMU (red arrow) and exposure to actinic light (400 μmol m−2 s−1) for 5, 10, or 30 min (gray bars), respectively. Fluorescence emission was measured in each well every 200 s.
(C) Addition of 5% (w/v) Suc or assay medium as a mock control; cycle time of fluorescence emission measurement per well: 200 s.
(D) Combination of Suc treatment as in (C) with light exposure as in (B) with identical measurement cycle time.
(E) Addition of 20 μM AA or ethanol as a solvent control. Fluorescence emission was measured in each well every 94 s.
(F) Combination of AA treatment as in (E) with light exposure as in (B). Fluorescence emission was measured in each well every 107 s. The experiments were repeated independently at least three times with consistent results.

