Figure 6.
In Vitro Characteristics of the Peredox-mCherry DS Variant.
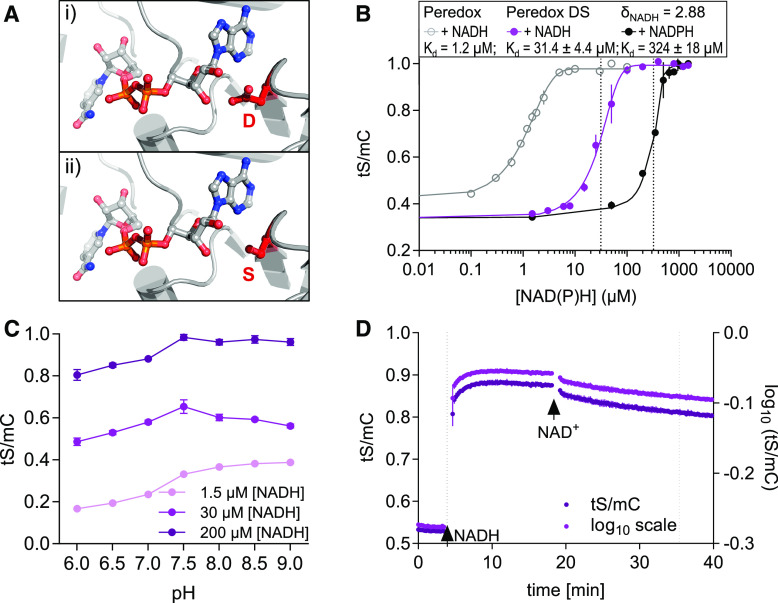
(A) Structural model of the Rex binding pocket for NAD(H) (PDB: 3IKT). (i) A D residue stabilizes NAD binding through a hydrogen bond with a Rib hydroxyl-moiety. (ii) This D was exchanged for an S to abolish the hydrogen bond and to decrease the binding affinity in the DS variant.
(B) Ratiometric response of the Peredox-mCherry DS variant compared to Peredox-mCherry (log10(tS/mC)) at different NADH and NADPH concentrations in the presence of 500 µM NAD+ and 150 µM NADP+, respectively. Sensor protein concentration: 0.025 µg/µL, n = 3, mean ± sd, pH 7.5. The ratio values were normalized to the highest ratio (set to 1). Dotted lines indicate Kd-values (sigmoidal curve fitting with details provided in Supplemental Data Set 1G).
(C) Response of the DS sensor variant to different pH values. Sensor protein was equilibrated with three different NADH concentrations (1.5, 30, and 200 µM) in the presence of 500 µM NAD+ to achieve low, mean, and high NADH occupancy at different pH values (6.0 to 9.0, n = 3, mean ± sd; Bis-Tris for pH 6.0 to 7.0 and Tris-HCl for pH 7.5 to 9.0).
(D) NADH binding to and dissociation from Peredox-mCherry DS in vitro. Time resolved tS/mC (magenta, left y axis) and corresponding log10 ratio (dark purple, right y axis) changes in recombinant sensor protein (0.025 µg/µL, Tris-HCl, pH 7.5) in response to NADH (30 µM, first arrow) in the presence of 500 μM NAD+ and to further NAD+ addition (500 µM, second arrow). Dotted lines indicate time to reach half of the response amplitude at NADH or NAD+ addition (one-phase decay fit; Supplemental Data Set 1H). Fluorescence emission was measured every 13 s. Excitation, 400 ± 10 nm (tS) and 570 ± 10 nm (mC); emission, 520 ± 5 nm (tS) and 610 ± 5 nm (mC). The assay was independently repeated three times with consistent results.

