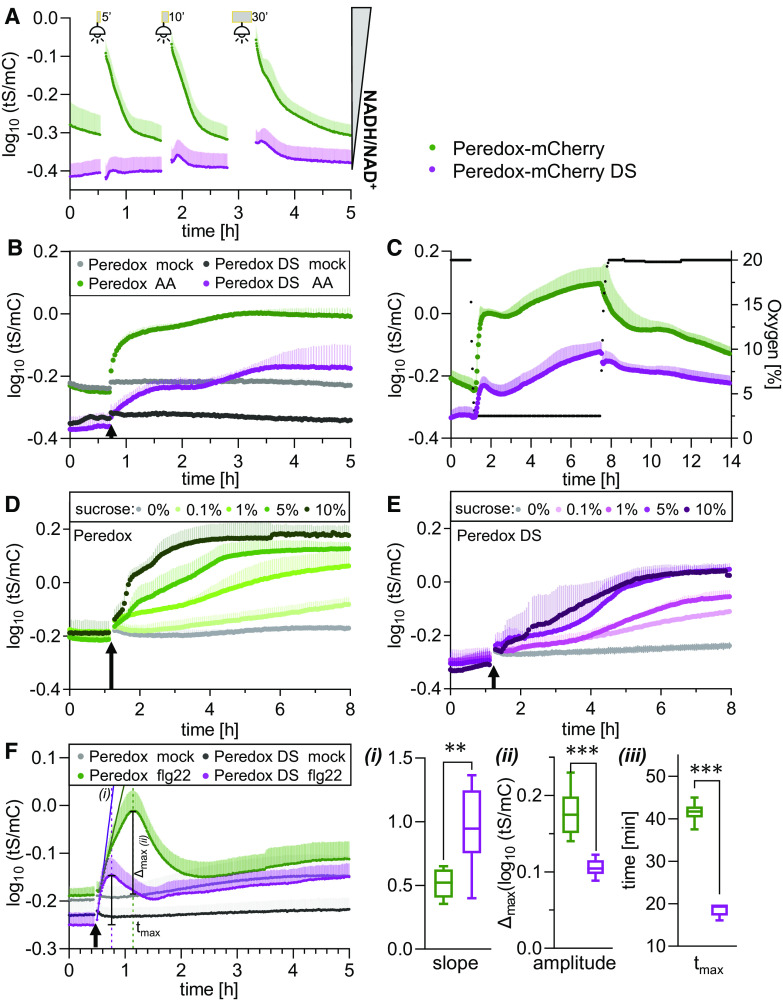
Figure 7.
In Vivo Peredox-mCherry DS Response Range of NAD Redox Dynamics upon Changes in Illumination, Respiratory Activity, and External Sugar Supply.
Side-by-side multiwell plate reader–based time-course measurements of Peredox-mCherry and Peredox-mCherry DS ratio (log10(tS/mC)) of leaf discs from 5-week-old Arabidopsis plants dark adapted for at least 90 min prior to treatments. Excitation at 400 ± 10 nm (tS) and 570 ± 10 nm (mC); emission at 515 ± 7.5 nm (tS) and 610 ± 5 nm (mC). n ≥ 5, means + sd.
(A) Exposure to actinic light (400 μmol m−2 s−1) for 5, 10, or 30 min (gray bars). Fluorescence emission was recorded every 25 s in each well.
(B) Addition of 20 μM AA or ethanol as a solvent control (mock). Arrows indicate treatment application. Cycle time of fluorescence emission measurement per well: 120 s.
(C) Hypoxia induction by lowering the oxygen concentration to 2.5% by substitution of air with nitrogen. Green dots, Peredox-mCherry; purple dots, Peredox-mCherry DS; black dots, oxygen concentration. Oxygen concentration is indicated by the right y axis; cycle time of fluorescence emission measurement per well: 120 s.
(D) and (E) Supplementation with different Suc concentrations (0 to 10% [w/v] in assay medium) at the indicated time point (arrow) for Peredox-mCherry (D) and Peredox-mCherry DS (E). Fluorescence emission was recorded every 200 s in each well.
(F) Treatment with 10 µM flg22 (in assay medium) at the indicated time point (arrow) for Peredox-mCherry and Peredox-mCherry DS. (i) Slope of the linear regression during the linear increase of the transient in log10(tS/mC) per hour (Supplemental Data Set 1J). (ii) Transient amplitude (Δmax). (iii) Time after treatment needed to reach the transient maximum (tmax). Student’s t-test, **P < 0.01, ***P < 0.001 (Supplemental Data Set 1J). Measurements were repeated independently at least three times with consistent results.

