Figure 5.
Size Distribution, Annotation, and Spatial Distribution of Small RNAs from High-Throughput Sequencing Data.
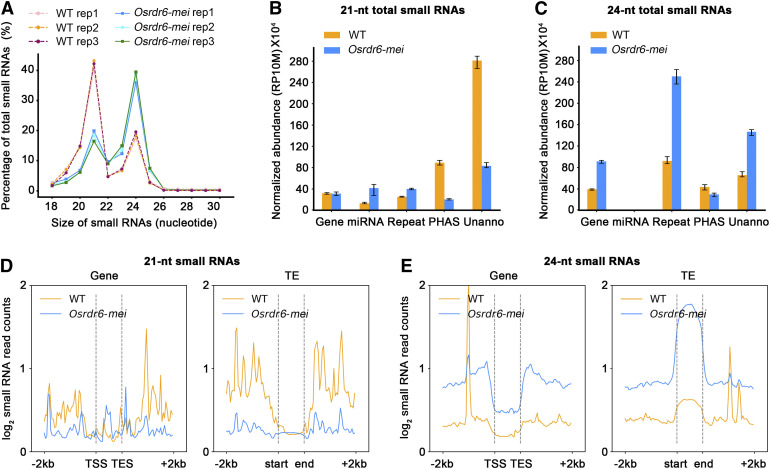
(A) Size distribution of small RNAs in the wild type (WT) and Osrdr6-mei. The abundance of small RNAs in each size class is shown as a percentage of the total abundance of small RNAs.
(B) Annotation of 21-nucleotide (nt) small RNAs in the wild type (WT) and Osrdr6-mei. RP10M, reads per 10 million.
(C) Annotation of 24-nucleotide (nt) small RNAs in the wild type (WT) and Osrdr6-mei.
(D) Distribution of 21-nucleotide (nt) small RNAs around genes (left) and TEs (right). Profiles of average abundance in the wild type (WT) and Osrdr6-mei are shown.
(E) Distribution of 24-nucleotide (nt) small RNAs around genes (left) and TEs (right). Profiles of average abundance in the wild type (WT) and Osrdr6-mei are shown.

