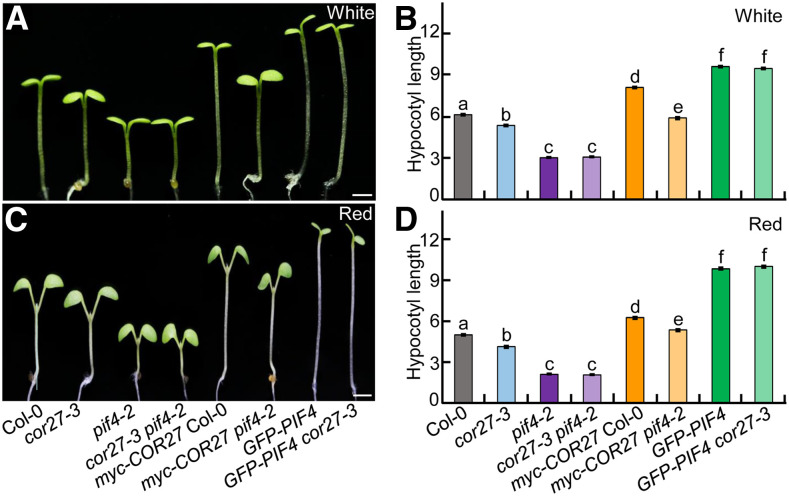
Figure 9.
COR27 Acts Upstream of PIF4.
(A) to (D) Hypocotyl phenotypes and length for 4-d-old seedlings of the indicated genotypes grown in white- (7.5 μmol/m2/s; see [A] and [B]) or red- (110 μmol/m2/s; see [C] and [D]) light conditions. Bar = 1 mm. In (B) and (D), the data represent means ± se (n ≥ 60) of three biological replicates. Letters above the bars indicate significant differences (P < 0.05), as determined by one-way ANOVA with Tukey’s post hoc analysis.

