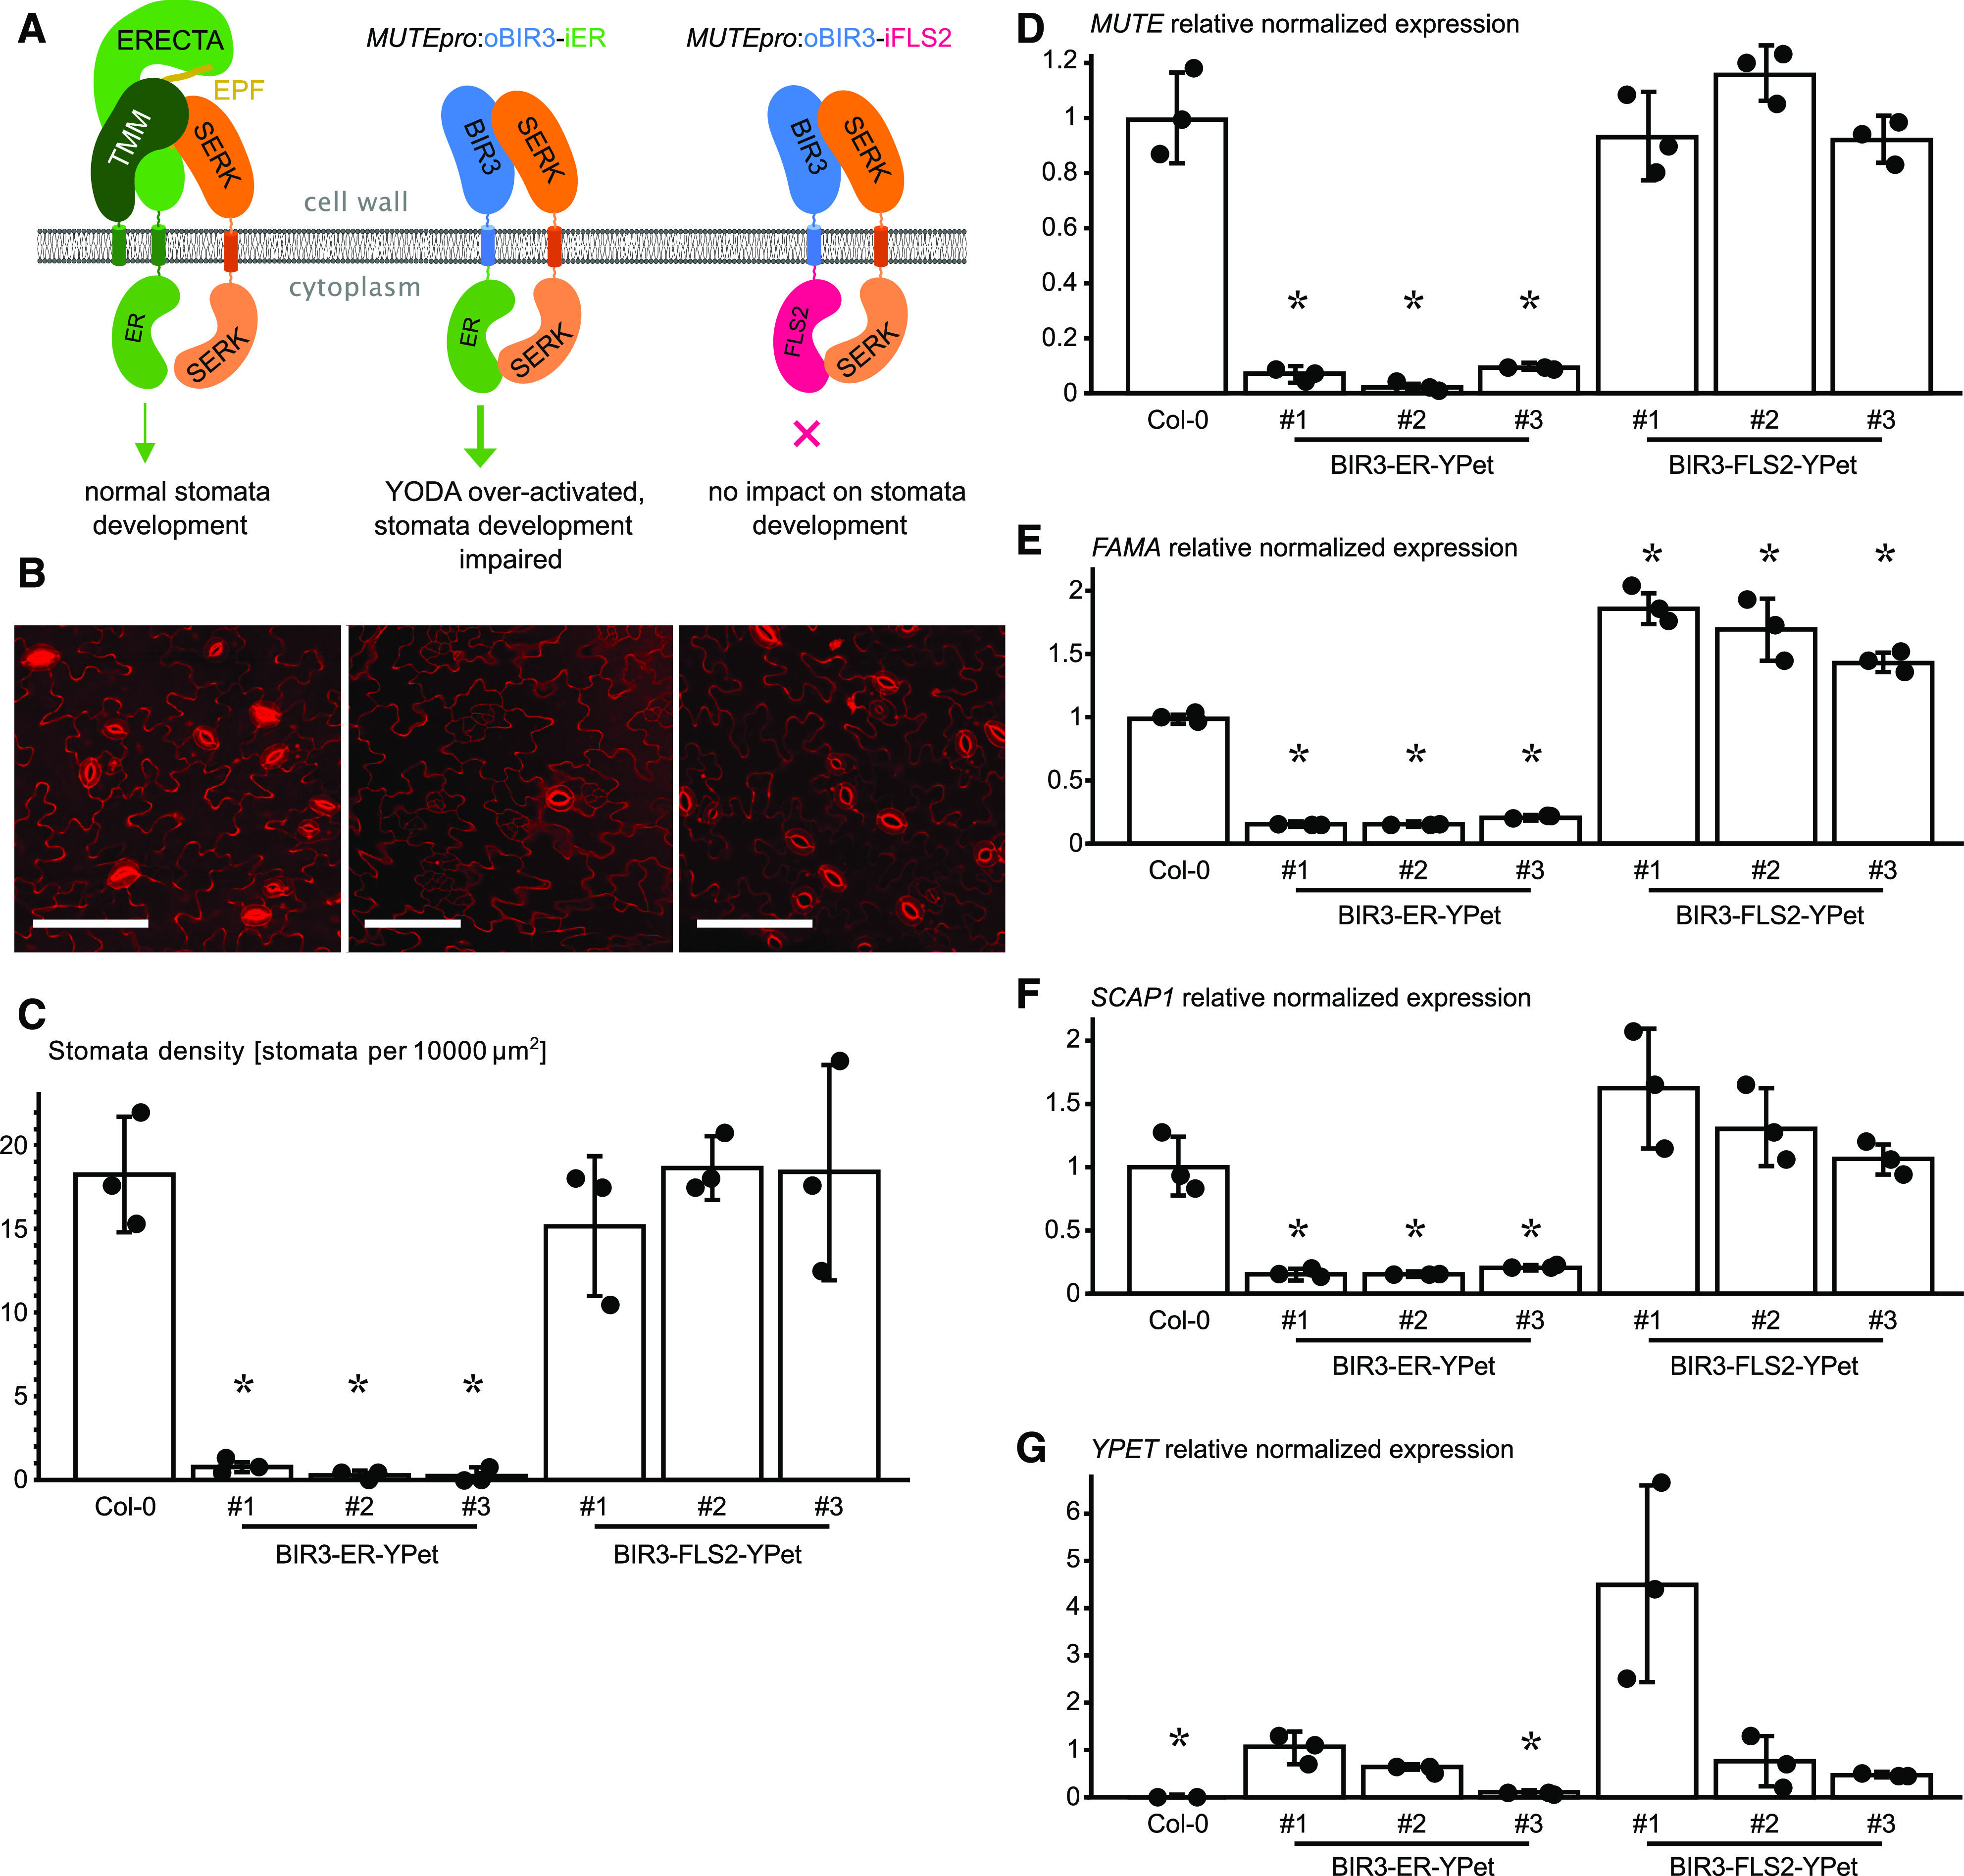
Figure 4.

BIR3 chimeras Reveal a Conserved Receptor Activation Mechanism in the LRR-RK ERECTA.
(A) Schematic overview of the ectopically expressed BIR chimera. The receptor kinase ERECTA (ER) interacts with SERK-coreceptor kinases upon ligand (EPF) binding and regulates stomata development (left). Expression of an oBIR3-iER chimera in the epidermis under the MUTE promoter (MUTEpro) leads to pathway over-activation and the loss of stomata (middle), while the expression of an oBIR3-iFLS2 chimera has no effect on stomata development.
(B) Confocal microscopy images of PI-stained epidermis of the indicated genotype. Representative images of Col-0 (left), BIR3-ER-YPet (center), and BIR3-FLS2-YPet (right) are shown. Bar = 100 µm.
(C) Abaxial stomata density of cotyledons (# numbers indicate independent lines). The average value of stomata density for three individual plants of each transgenic line is shown. Error bars depict sds. Individual data points are shown as dots. Significant differences to the wild type are indicated by an asterisk (t test; P < 0.05).
(D) Expression level of the respective transgenes detected by RT-qPCR of MUTE. Data are shown as means ± sd (n = 3). Individual data points are shown as dots. Expression in the wild type was arbitrarily set to 1. Significant differences to the wild-type levels are indicated by an asterisk (t test; P < 0.05).
(E) Relative normalized expression of FAMA. Normalized expression values of FAMA determined by RT-qPCR are shown as means ± sd (n = 3). Individual data points are shown as dots. Expression in the wild type was arbitrarily set to 1. Significant differences to the wild-type levels are indicated by an asterisk (t test; P < 0.05).
(F) Relative normalized expression of SCAP1. Normalized expression values determined by RT-qPCR are shown as means ± sd (n = 3). Individual data points are shown as dots. Expression in the wild type was arbitrarily set to 1. Significant differences to the wild-type levels are indicated by an asterisk (t test; P < 0.05).
(G) Expression level of the respective transgenes detected by RT-qPCR of YPet. Data are shown as means ± sd (n = 3). Individual data points are shown as dots. Expression in the oBIR3-iER-YPET line #1 was arbitrarily set to 1. Significant differences in transgene expression to line #1 is indicated by an asterisk (t test; P < 0.05).
