
Figure 11.
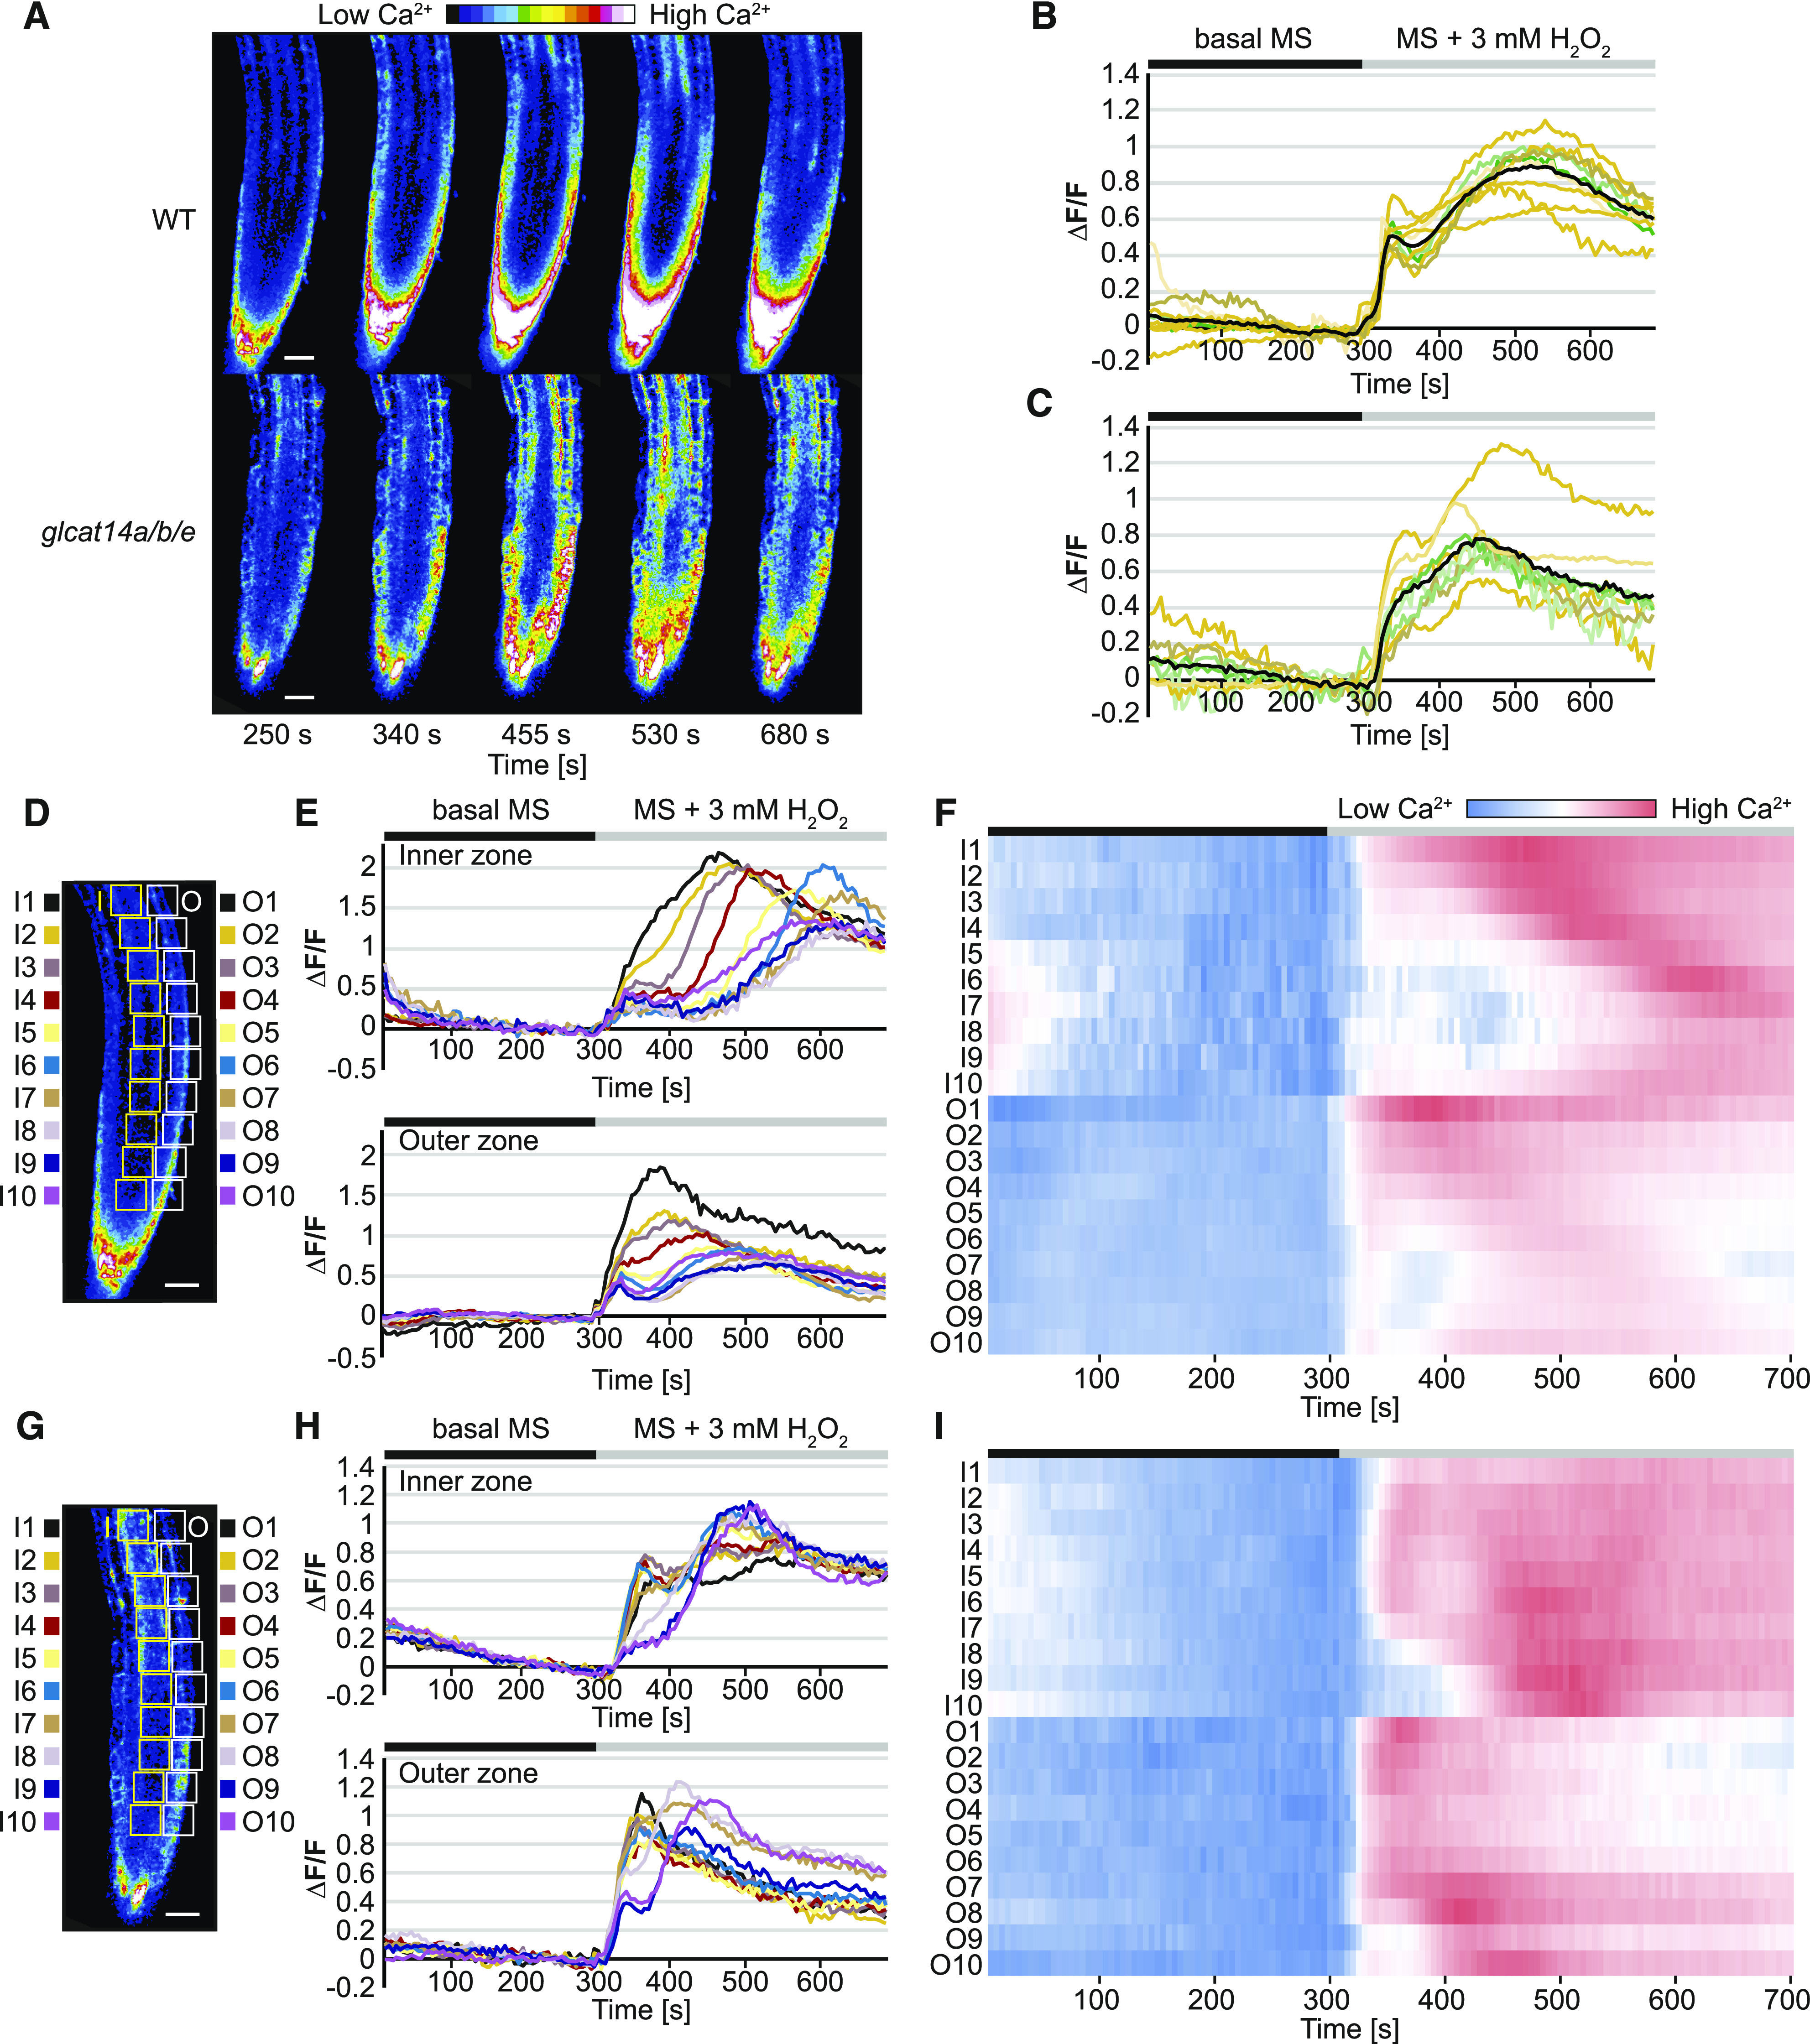
H2O2-Induced [Ca2+]cyt Signals Are Perturbed in glcat14a/b/e Roots.
(A) [Ca2+]cyt-dependent R-GECO1 fluorescence signal in response to 3 mM H2O2 in 4-d-old wild-type and glcat14a/b/e mutant seedlings. The H2O2 treatment was applied at ∼300 s. The images are still frames from Supplemental Movie 1 for the wild-type roots and Supplemental Movie 2 for glcat14a/b/e roots.
(B) and (C) Normalized R-GECO1 fluorescence intensities (∆F/F) of [Ca2+]cyt transients induced by 3 mM H2O2 in wild-type (B) and glcat14a/b/e (C) roots. The orange and green lines are single biological replicates. The black lines represent the mean values of the biological replicates. n = 9 for the wild type and n = 8 for glcat14a/b/e.
(D) to (I) Spatiotemporal analysis of H2O2-induced [Ca2+]cyt transients from (B) and (C). Consecutive ROIs were selected along the inner (I) and outer (O) zones of the roots from the wild type ([D] to [F]) and glcat14a/b/e mutants ([G] to [I]). The normalized values of R-GECO1 fluorescence intensities from each ROI are represented by line graphs ([E] and [H]). Heat maps represent normalized values across ROIs at the inner and outer zones of the roots ([F] and [I]). The bars above the graphs indicate the adaptation time with basal MS (black) and the time of perfusion with the treatment (gray). Bars in (D) and (G) = 30 μm.