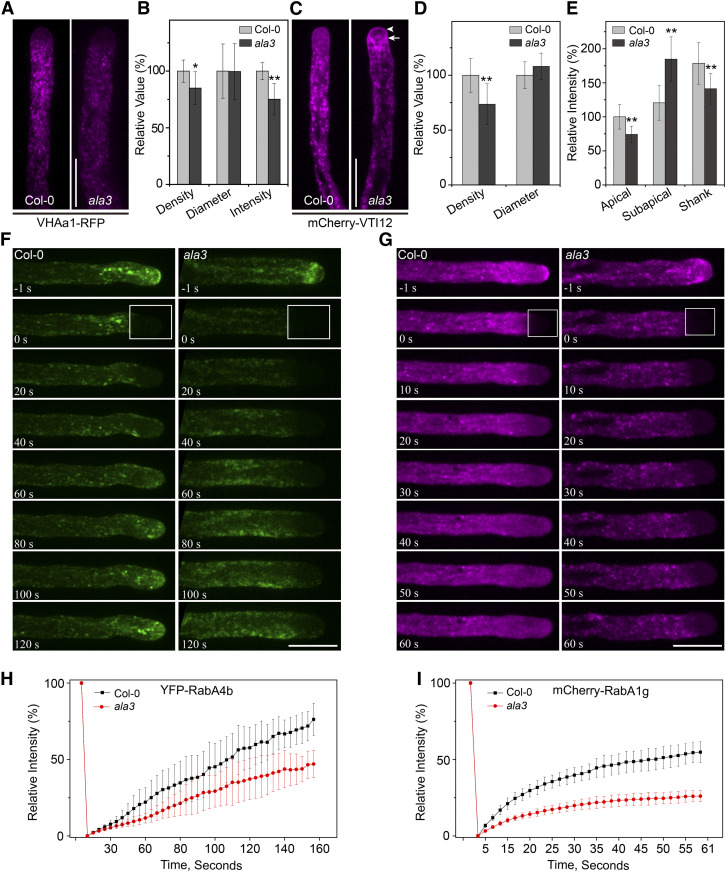
Figure 5.
Loss of ALA3 Leads to Abnormal Distribution of the TGN/EE in Pollen Tubes.
(A) Representative confocal images of growing pollen tubes from Col-0 and ala3-expressing VHAa1-RFP from the same transgene. Bar = 10 μm.
(B) Quantification of the relative puncta density, diameter, and fluorescence intensity marked by VHAa1-RFP in Col-0 and ala3 pollen tubes. The results represent the means ± sds (n = 30). *P < 0.05; **P < 0.01 (t test compared to wild-type values).
(C) Representative confocal images of growing pollen tubes from Col-0 and ala3-expressing mCherry-VTI12 from the same transgenic line. The arrowhead and arrow indicate the apical and subapical zones, respectively. Bar = 10 μm.
(D) Quantification of the relative puncta density and diameter marked by mCherry-VTI12 in Col-0 and ala3 pollen tubes. The results represent the means ± sds (n = 30). **P < 0.01 (t test compared to wild-type values).
(E) Quantification of the relative fluorescence intensity of mCherry-VTI12 in Col-0 and ala3 pollen tubes. The results represent the means ± sds (n = 30). **P < 0.01 (t test compared to wild-type values).
(F) Fluorescence recovery after photobleaching (FRAP) analysis of YFP-RabA4b in growing pollen tubes. The time points after photobleaching are labeled in each image. The bleached area is marked by the box. Bar = 10 μm.
(G) FRAP analysis of mCherry-RabA1g in growing pollen tubes. The time points after photobleaching are labeled in each image. The bleached area is marked by the box. Bar = 10 μm.
(H) Measurement of the mean YFP fluorescence intensity of the bleached area in (F). The results represent the means ± sds (n = 7).
(I) Measurement of the mean mCherry fluorescence intensity of the bleached area in (G). The results represent the means ± sds (n = 7).

