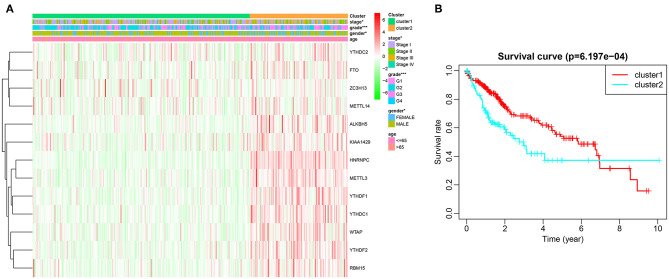
Figure 3.
Difference in clinicopathological features and overall survival between cluster 1 and cluster 2. (A) Heatmap and clinicopathological characteristics of these two clusters. Green represents low expression and red represent high expression. (B) Comparison of overall survival (OS) between cluster 1 and cluster 2. *p < 0.05, ***p < 0.001.

