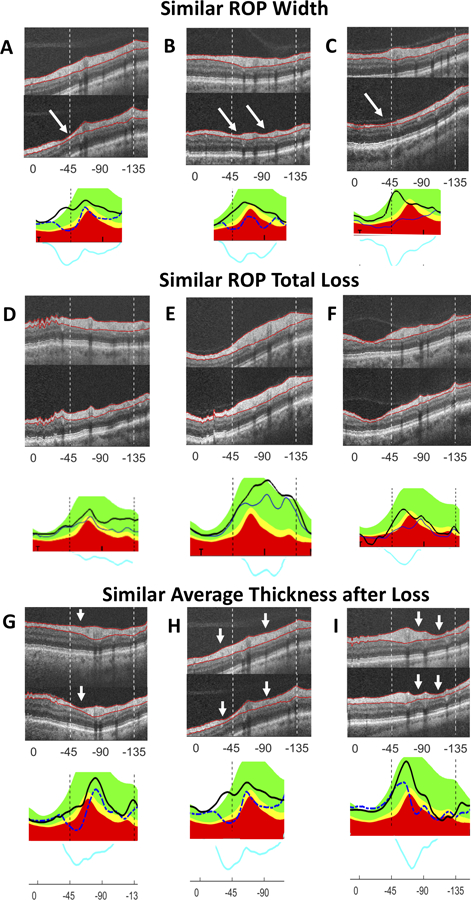
Figure 5:

(A–C) Similar ROP width but different patterns: Eyes with similar ROP width between first and last scans show different patterns of loss: A (eye 1 in Fig. 3)= 99.5°; B (11)=105.1°; C (14)=106.2°. (D–F) Similar ROP total loss but different patterns: Eyes with similar ROP total loss (area under blue difference curve) show different patterns of loss: D (eye 24 in Fig. 3)= 65,568.1 µm2; E (23)= 67,708.7 µm2; F (15)= 64,808.7 µm2. (D) showed wide loss which becomes deeper away from fixation, (E) showed a ROP of approximately equal thickness, and (F) showed a single deep area of local loss which is less wide than D or E. (G–I) Similar average amount but different patterns of RNFL remaining in study region: Eyes with similar average cRNFL thicknesses remaining in the study region (0- −135°) at the last scan dates demonstrate widely varying ROP width and depth: G (eye 8 in Fig. 3)= 70.6 µm; H (1)= 69.4 µm; I (17)= 67.8 µm. (G) demonstrated loss towards 0° relative to the blood vessel, (H) showed loss on either side of blood vessels, and (I) showed loss on the side of the blood vessels away from 0° (see white arrows). White arrows highlight variations in the width, number, and location of particularly deep areas of loss.
