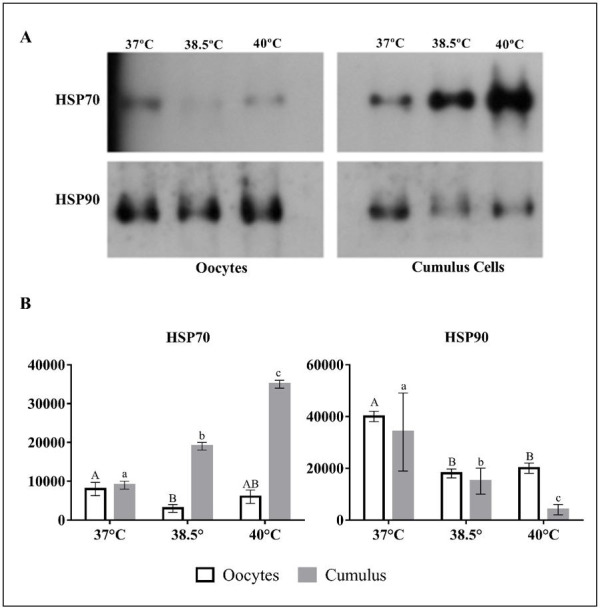
Figure 1. HSP70 and HSP90 abundance in zebu oocytes and cumulus cells after in vitro maturation at 37 °C, 38.5 °C, and 40 °C. (A) Examples of western blotting images (exposure time, 2 min); (B) Quantitative evaluation is represented by diagrams (mean and SD; three biological repeats). Different uppercase and lowercase letters indicate a significant difference (P < 0.05).

