Abstract
Purpose:
To test the hypothesis that glaucomatous damage can be accurately diagnosed in most high myopes via an assessment of the OCT results.
Patients & Methods:
100 eyes from 60 glaucoma patients or suspects, referred for OCT scans and evaluation, had corrected spherical refractive errors worse than −6D and/or axial lengths ≥ 26.5mm. An OCT specialist judged whether the eye had glaucomatous optic neuropathy (GON), based upon OCT circle scans of the disc and cube scans centered on the macula. A glaucoma specialist made the same judgement using all available information (e.g. family history, repeat visits, intraocular pressure, 10–2 and 24–2 visual fields, OCT). A reference standard (RS) was created based upon the glaucoma specialist’s classifications. Additionally, the glaucoma specialist judged whether the eyes had peripapillary atrophy (PPA), epiretinal membrane (ERM), tilted disc (TD), and/or a paravascular inner retinal defect (PIRD).
Results:
The OCT specialist correctly identified 97 of the 100 eyes using the OCT information. In 63% of the cases, the inner circle scan alone was sufficient. For the rest, additional scans were requested. Additionally, 81% of the total eyes had: PPA (79%), ERM (18%), PIRD (26%), and/or TD (48%).
Conclusion:
For most eyes with high myopia, there is sufficient information in OCT scans to allow for accurate diagnosis of GON. However, the optimal use of the OCT will depend upon training to read OCT scans, which includes taking into consideration myopia related OCT artifacts and segmentation errors, as well as PPA, ERM, PIRD, and TD.
Keywords: Glaucoma, High Myopia, OCT
Precis
It is generally assumed that OCT cannot be used to diagnose GON in high myopes. However, this study presents evidence that there is sufficient information in OCT scans to allow for accurate diagnosis of GON in most eyes with high myopia.
Introduction
Optical coherence tomography (OCT) has demonstrated utility in the detection and management of glaucoma—an optic neuropathy in which the selective loss of retinal ganglion cells and their axons results in the subsequent thinning of the retinal nerve fibers.1 The presence of high myopia, however, can complicate the OCT evaluation of a glaucoma patient or suspect. High myopes have greater axial lengths than the general population, and this can cause aberrant retinal anatomy, as well as affect the OCT image quality and analysis.2–8
The circumpapillary retinal nerve fiber layer (cpRNFL) measurement currently stands as the most commonly used OCT method to quantify structural loss in glaucoma.9–13 Suspect eyes have their cpRNFL profiles qualitatively and quantitatively evaluated against a normative database.14 However, in general, the commercial normative databases are restricted to eyes with refractive errors better than −6D.15 OCT detection of structural defects can thus prove challenging as high myopes without glaucomatous damage tend to have lower global cpRNFL than the control eyes.16 In addition, they demonstrate different topographical profiles—significantly thicker cpRNFL in the temporal quadrant of the disc and significantly thinner cpRNFL in the non-temporal quadrants.16 As a result, clinicians who rely heavily on the cpRNFL measurement and, in particular, summary metrics such as global or sectoral thickness may be prone to misdiagnose healthy high myopes.17,18
The OCT RNFL thickness and probability maps, as derived from the cube scans, more commonly serve an auxiliary role in the diagnosis of glaucoma as compared to the cpRNFL analysis.13,19 The cpRNFL is a cross-sectional circle image of the RNFL around the disc, whereas the RNFL thickness and probability maps allow a clinician to view the RNFL thickness over a larger region of the retina. As such, glaucomatous defects in the cpRNFL can be followed as arcuate defects in the RNFL thickness and probability maps.9,13 In the case of high myopes, however, the RNFL thickness maps may appear abnormally thin due to large axial length and retinal abnormalities.20–22 Additionally, the tendency of the inferotemporal and superotemporal nerve fiber bundles to be more temporally oriented will often result in an apparent lack of RNFL thickness in the inferior and superior retina.23 These anatomical differences, relative to control eyes, can yield arcuate-like artifacts in the RNFL probability maps that mirror the arcuate defects found in glaucomatous eyes.23
Finally, the OCT ganglion cell layer (GCL) thickness and probability maps, as derived from the cube scans, can also be employed as diagnostic tools. Local GCL thinning can be observed in the macula and tied to RNFL arcuate defects impinging on the macular region.9,13,19,24–26 GCL thinning may also occur prior to RNFL thinning and serve as an early indicator of glaucomatous damage.13,27 As a clinician, however, it can often be difficult to distinguish between defects in the GCL probability maps caused by glaucomatous damage and general thinning in the GCL probability maps due to large axial length in high myopes.28,29
In order to address these concerns regarding the use of OCT in the evaluation of glaucoma, some have advocated for a high myopia OCT normative group.30–32 At the moment, however, normative groups for high myopia are not yet available in commercial instruments, and, when available, will need validating. Thus, the purpose here is to test the hypothesis that glaucomatous damage can be accurately diagnosed in most high myopes via an assessment of the OCT results.
Patients and Methods
The Institutional Review Boards of Columbia University and the New York Eye and Ear Infirmary of Mount Sinai prospectively approved this retrospective, observational, cross-sectional study. The approval included the collection, deidentification, exporting and analysis of OCT scans and other ophthalmic-related records. It followed the tenets of the Declaration of Helsinki and the Health Insurance Portability and Accountability Act. Written informed consent was obtained from all patients.
Patients
The study included 100 eyes from 60 consecutive patients who were initially diagnosed as glaucoma patients, or glaucoma suspects, by a glaucoma specialist (R.R.) and were referred to our laboratory for OCT scans and evaluation. The patients and suspects were predominantly Caucasian and had a mean age of 55.5 ± 14.6 years (range: 25 to 89 years). All eyes had corrected spherical refractive errors worse than −6D and/or axial lengths ≥ 26.5mm. See Table 1 for more information regarding the glaucoma patients and suspects. We did not apply any exclusion criteria (e.g. poor scan quality or comorbidity) so as to mimic real clinical challenges.
Table 1.
Study Participants (Mean ± Standard Deviation)
| Age | 55.5 ± 14.6 years (range: 25 to 89 years) | 60 Patients |
| Sex | 39 Male; 21 Female | 60 Patients |
| Spherical Equivalence | −8.4 ± 3.0 D (range: −6.0 to −14.4 D); | 59 Eyes |
| Axial Length | 28.0 ± 2.3 mm (range: 26.5 to 31.6 mm) | 82 Eyes |
| IOP Max. | 18.9 ± 6.6 mmHg (range: 7 to 54 mmHg) | 100 Eyes |
| Cup-to-Disc Ratio (CDR) | 0.6 ± 0.2 (range: 0.2 to 0.9) | 66 Eyes |
| 24–2 Mean Deviation (MD) | −5.4 ± 5.4 dB (range: −27.0 to 2.2 dB) | 100 Eyes |
| 24–2 Pattern Deviation (PD) | 5.0 ± 4.3 (range: 0.8 to 14.8 dB) | 100 Eyes |
Optical Coherence Tomography (OCT)
All eyes were scanned on the Spectralis HRA+OCT with the Glaucoma Module Premium protocol (Heidelberg Engineering Inc, Heidelberg, Germany). As part of this protocol, 3 high-resolution (average of 100 b-scans) OCT circle scans were acquired in a high-speed mode. The commercial report for the circle scans included the averaged circular b-scan image (Fig. 1B), a sectorial pie chart of the cpRNFL thicknesses (Fig. 1C), and the cpRNFL thickness profile (Fig. 1D). It also had an infrared (IR) photograph of the disc (Fig. 1A), which was only used by the OCT specialist to verify the location of the circular b-scan. A cube scan (30° × 25°) with 61 horizontal b-scans and a cube scan (15° × 30°) with 19 vertical b-scans were also centered on the macula and acquired for each eye. The commercial reports derived from the horizontal cube scan, in combination with the OCT radial + circle scan, included the following diagnostic features of interest in this study: the RNFL thickness map (Fig. 2A; red rectangle), and the GCL thickness map (Fig. 2B; red rectangle). Additionally, the horizontal b-scan images (Fig. 3A) and vertical b-scan images (Fig. 3B) were exported from the horizontal cube scan and vertical cube scan, respectively.
Figure 1.
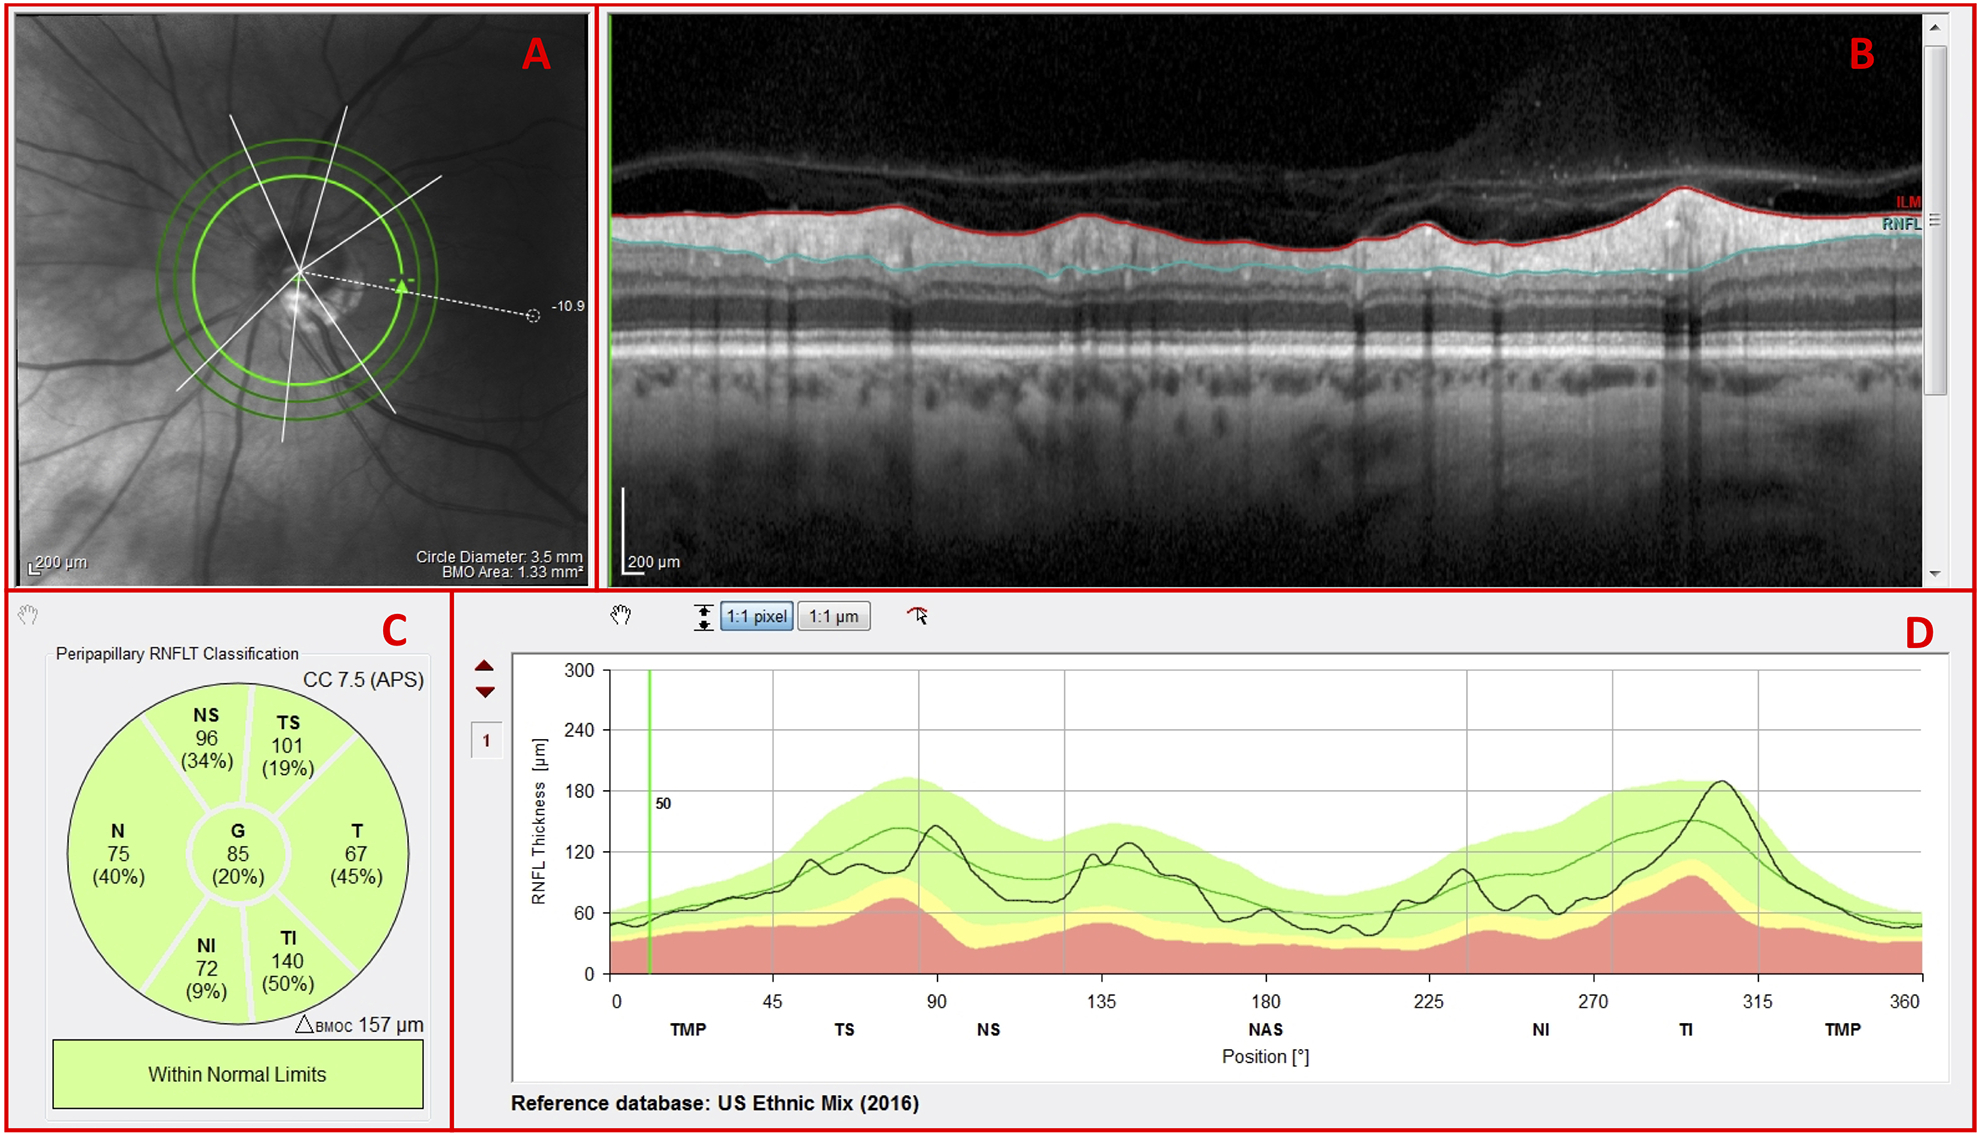
Spectralis HRA+OCT commercial circle scan report with an (A) infrared (IR) projection of the disc, (B) averaged circular b-scan image, (C) cpRNFL thickness pie chart, and (D) cpRNFL thickness profile
Figure 2.

Spectralis HRA+OCT commercial MRW, RNFL, & Assymmetry Single Exam Report with (A) retinal nerve fiber layer (RNFL) thickness map; and Thickness Map Single Exam Report with (B) ganglion cell layer (GCL) thickness map
Figure 3.
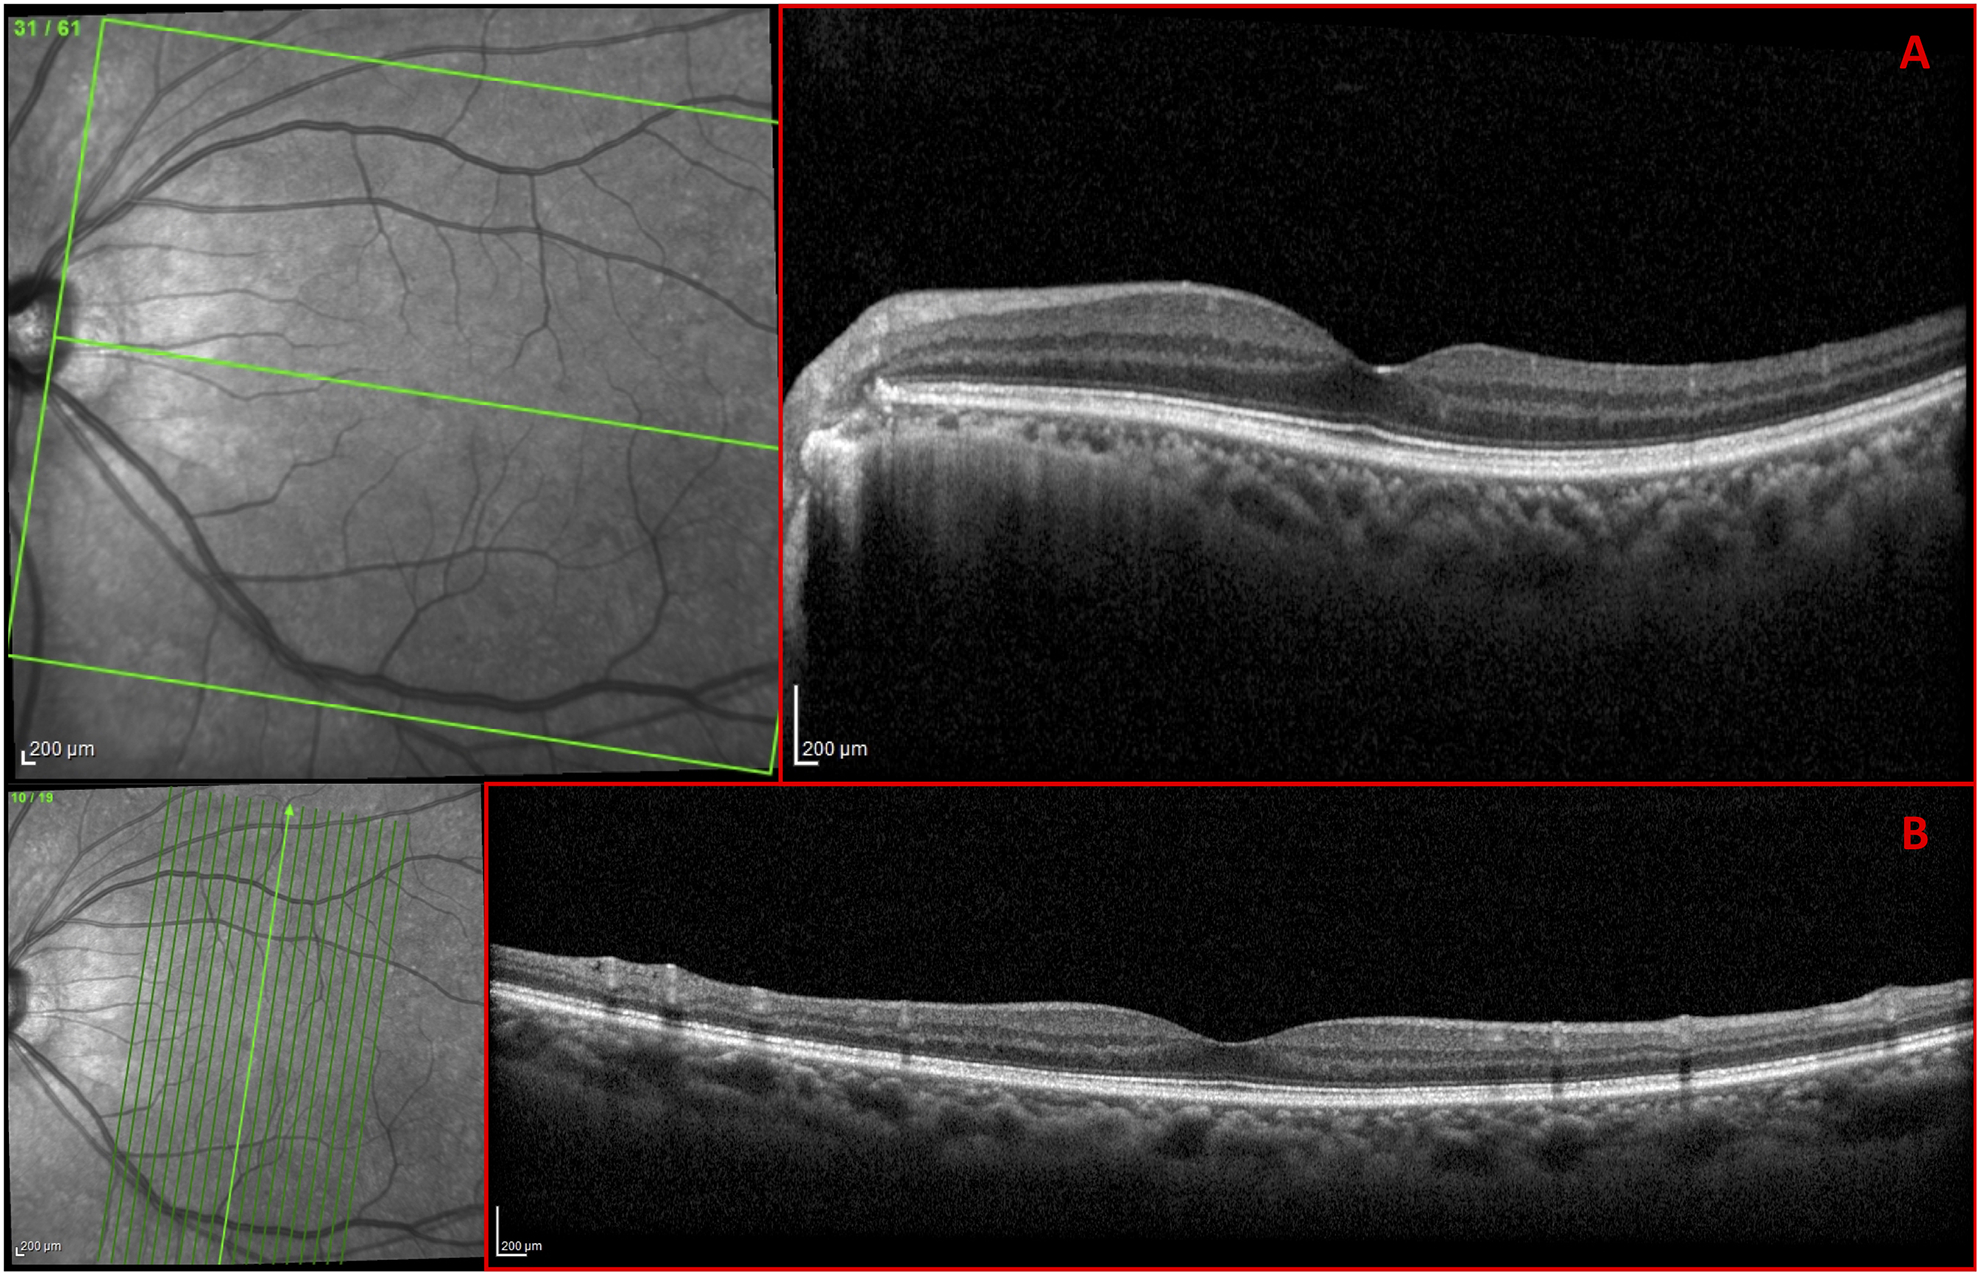
Spectralis HRA+OCT 30° × 25° cube scan with 61 (A) horizontal b-scans; and 15° × 30° cube scan with 19 (B) vertical b-scans
Reference Standard
A glaucoma specialist (R.J.), not involved in the patient’s care, judged whether each eye had glaucomatous optic neuropathy (GON) using all of the available information (e.g. family history, repeat visits, intraocular pressure, 10–2 and 24–2 visual fields, OCT). The glaucoma specialist’s classification constituted the reference standard (RS).This specialist was chosen as she had trained with the senior authors (D.C.H. and R.R.) and was adept at integrating OCT information into clinical judgments and looking closely at b-scan images. Ultimately, of the initial 100 eyes, 64 eyes were determined to have had glaucomatous optic neuropathy.
OCT Specialist
The OCT specialist (D.C.H.) sequentially examined the OCT scans, using a “minimalist approach”, in order of perceived diagnostic utility. First, he judged whether each eye had glaucomatous optic nerve damage based only upon components of the Heidelberg 3.5 mm inner circle scan (Fig. 1B–D). If he wanted additional information to make a decision and/or confirm his judgment, he had the option of asking for additional information, as seen in Figs. 1–3, in the following order: 1. the outer circle scans—the Heidelberg 4.1 mm circle scan and 4.7 mm circle scan; 2. the RNFL thickness map (Fig. 2A) and GCL thickness map (Fig. 2B); and 3. the B-scans through the horizontal cube scan (Fig. 3A) and vertical cube scan (Fig. 3B).
The main outcome measure was the number of eyes that were correctly judged by the OCT specialist based upon the RS.
Co-existing Ophthalmic Pathologies
In order to determine the frequency of disruptive co-existing ophthalmic pathologies in myopic eyes, the glaucoma specialist (R.J.) evaluated a fundus photo and a custom-built en-face slab image for the presence of peripapillary atrophy (PPA), epiretinal membrane (ERM), tilted disc (TD), and/or a paravascular inner retinal defect (PIRD) — a fissure-like defect in the inner retina or located adjacent to major blood vessels.5,13,33
Results
The glaucoma specialist classified 36 of the 100 eyes as non-glaucomatous (NG) and 64 as glaucomatous (G). The OCT specialist correctly identified 97 of these 100 eyes; 1 of the NG and 2 of the G eyes were incorrectly categorized. Table 2 summarizes the information used, sequentially, by the OCT specialist in making these judgments.
Table 2.
Methodology and Results for OCT Specialist
| Only Inner Circle Scan | (+) Outer Circle Scans | (+) Thickness Maps | (+) B-scans | Total | |
|---|---|---|---|---|---|
| Correct | 63 | 11 | 20 | 3 | 97 |
| Incorrect | 0 | 0 | 3 | 0 | 3 |
| Total | 63 | 11 | 23 | 3 | 100 |
Only Inner Circle Scan
The OCT specialist used only the inner circle scan for diagnosis in 63 of the 100 eyes. All 63 eyes were correctly classified as per the reference standard (RS); 20 of these eyes were classified as NG and 43 as G.
The high myopes within the NG group typically had cpRNFL thickness profiles (Fig. 4A; black curve indicated by the black arrow) that fell largely within the 95% limits of the normative group (Fig. 4A; green region within the purple rectangle). The corresponding circular B-scan images (Fig. 4A; blue rectangle) also did not reveal any anatomical features indicative of thinning, such as exposed blood vessels or clear local damage.
Figure 4.
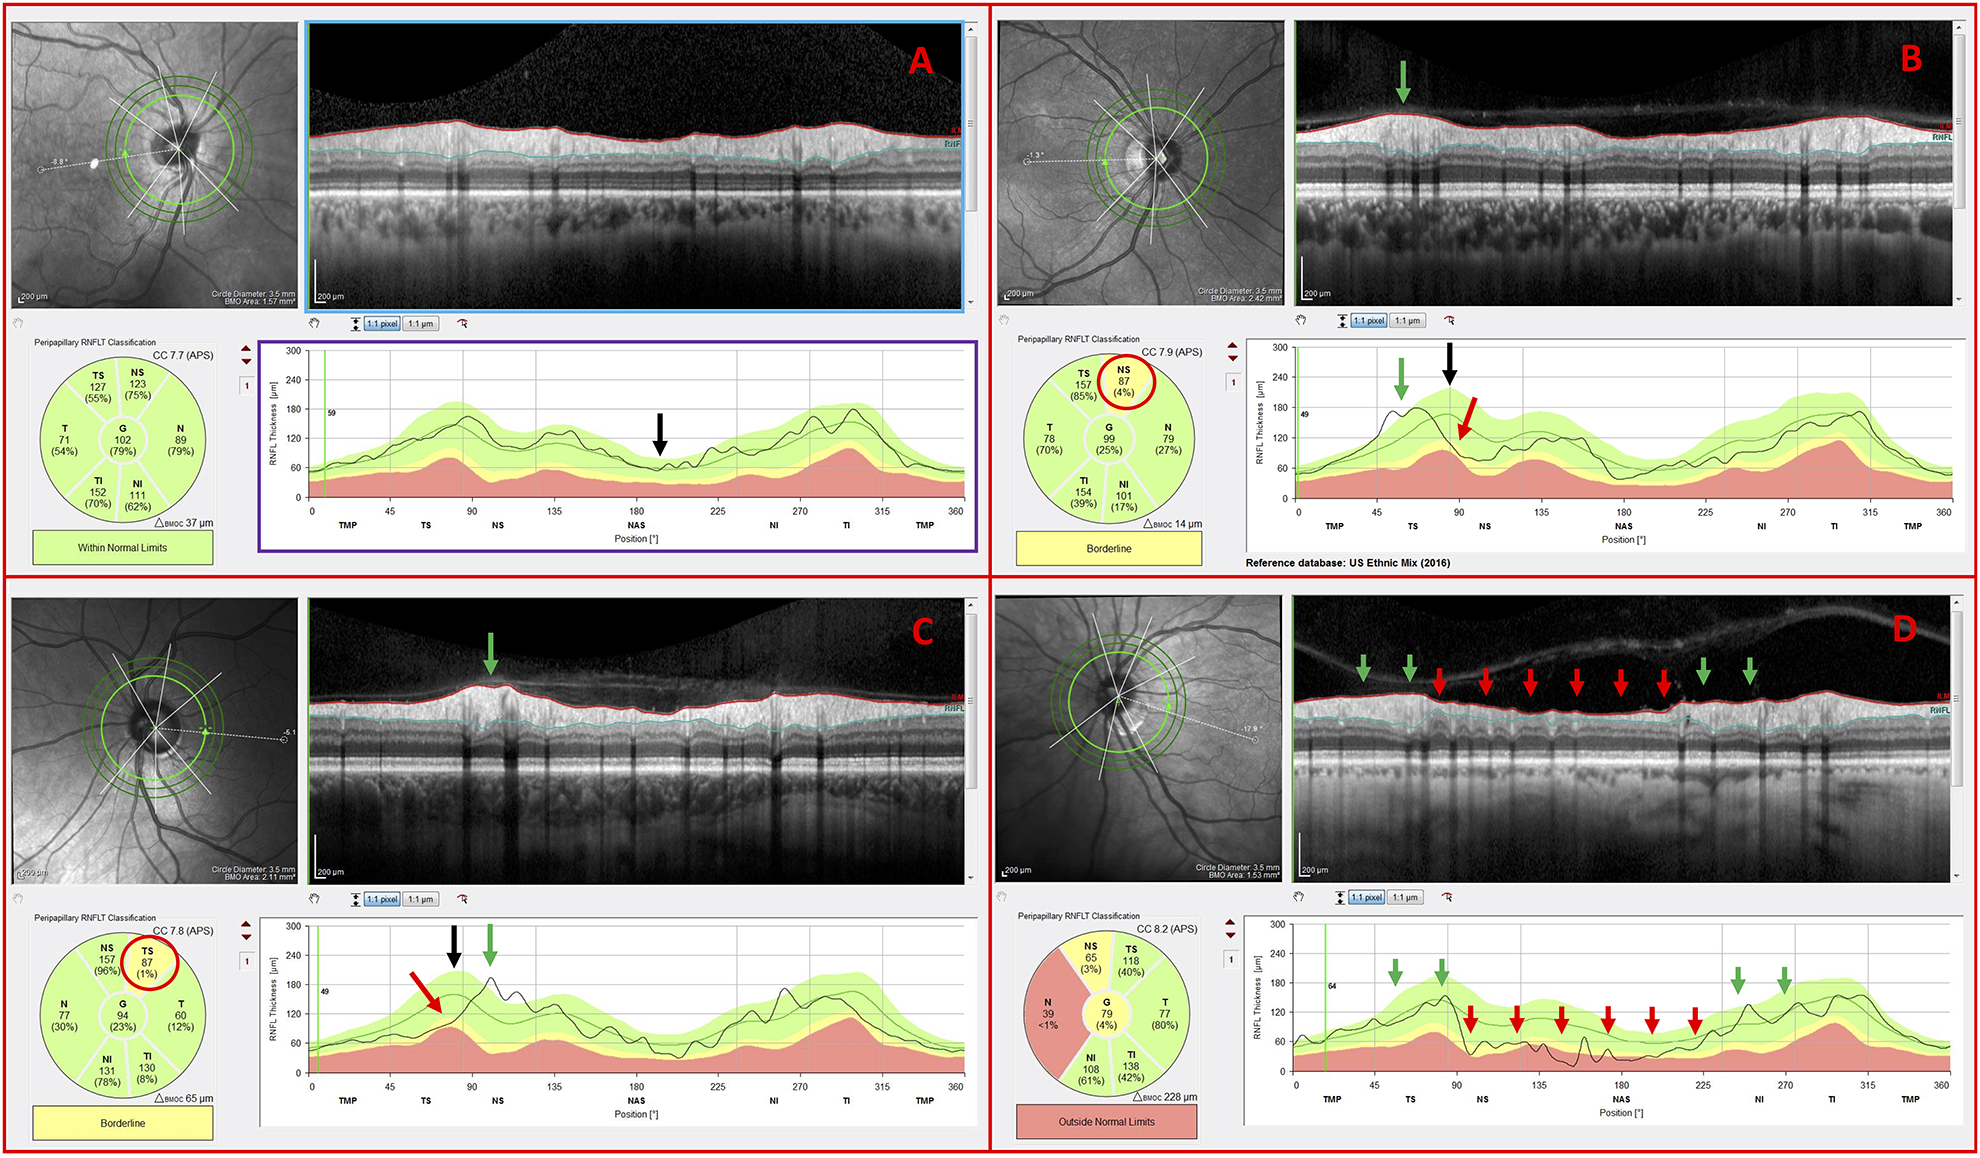
Inner circle scans of non-glaucomatous (NG) eyes carrying the following observed features: (A) cpRNFL thickness profile within normal limits (B) blood vessel displacement toward the temporal region, (C) blood vessel displacement toward the nasal region, and (D) NG optic neuropathy
The cpRNFL profile in some of the NG eyes had “abnormal regions” as indicated on the reports (Fig. 4B & Fig. 4C; red arrows and ovals). The location of the major temporal blood vessels in these eyes was easily identified as the cause of this apparent “abnormal region” by comparing the location of the eyes’ major temporal vessels (Fig. 4B & Fig. 4C; green arrows) to the peaks in the normative values (Fig. 4B & Fig. 4C; black arrows). These peaks are associated with the major temporal vessels.34 In another example, the OCT specialist correctly identified optic neuropathy, but noted that ischemic optic neuropathy (ION) had to be ruled out as there was an abrupt change in the cpRNFL thickness between the normal regions (Fig. 4D; green arrows) and abnormal nasal regions (Fig. 4D; red arrows) of the cpRNFL thickness plot often seen in eyes with ION. The glaucoma specialist also questioned whether the eye had ION based upon the fundus photographs. A neuro-ophthalmologist also agreed that ION had to be ruled out. Note: This eye could have been excluded from this study, but as it was diagnosed initially as glaucoma by the referring specialist, we felt it important to include.
The high myopes within the G group typically showed deep cpRNFL defects (Fig. 5A; red arrows), widespread cpRNFL damage (Fig. 5B; red arrows), and/or local defects (Fig. 5C & Fig. 5D). Notice in Figure 5C that there were exposed blood vessels (Fig. 5C; red ovals), and in the case of Figure 5D that there was a deep local cpRNFL defect (Fig. 5D; red arrows) that did not appear abnormal on the summary metrics (Fig. 5D, red oval).
Figure 5.
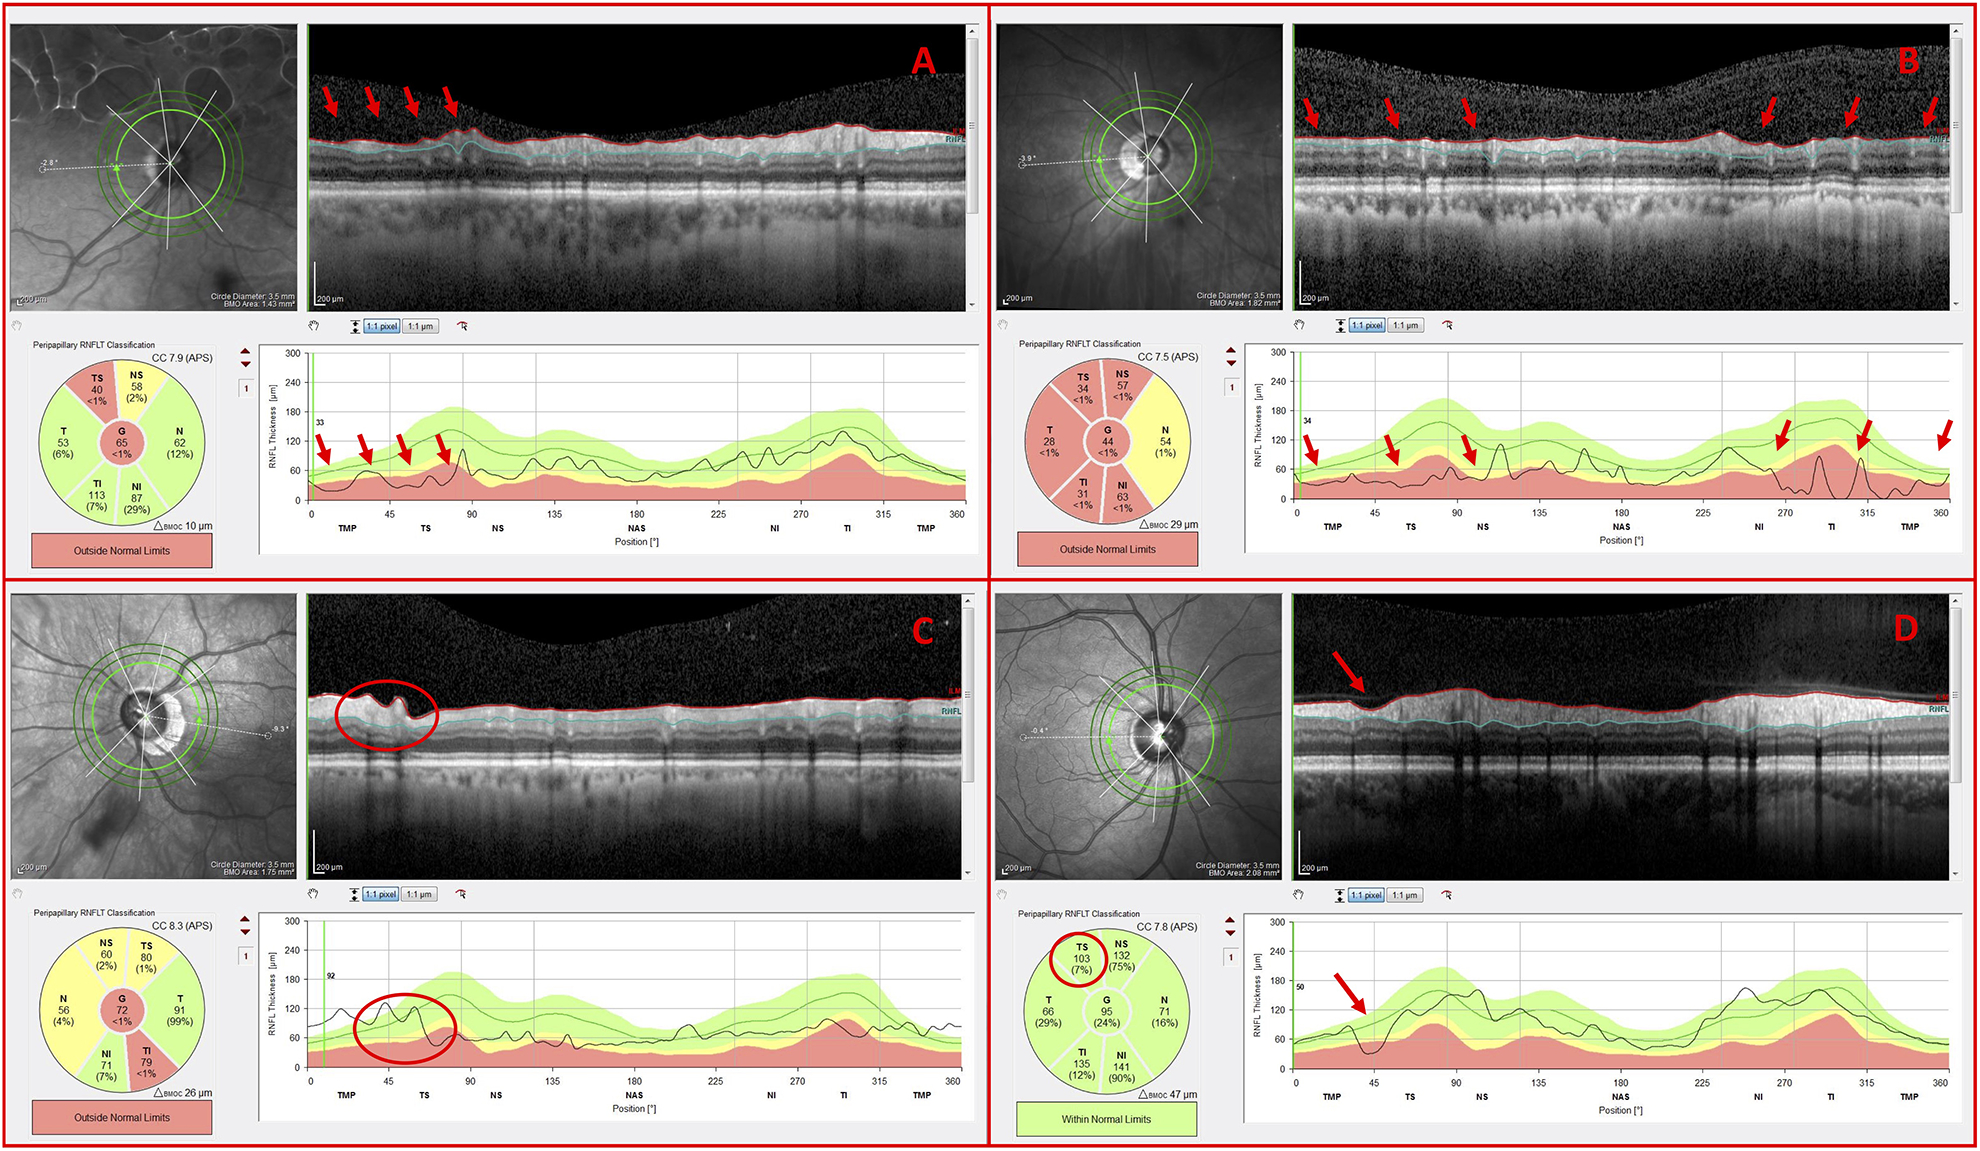
Inner circle scans of glaucomatous (G) eyes carrying the following observed features: (A) deep cpRNFL thickness defects (B) widespread cpRNFL damage (C) exposed blood vessels, and (D) local cpRNFL defect that was missed by cpRNFL thickness pie chart
(+) Outer Circle Scans
In 37 out of 100 eyes, the OCT specialist requested additional OCT information. For 11 of these eyes, the OCT specialist looked at the 2 outer circle scans, as well as the inner circle scan. All 11 eyes were correctly classified as per the RS; 2 of these eyes were classified as NG and 9 as G.
All 11 eyes had one or more disruptive co-existing pathologies and/or a high myopia-associated OCT artifact. In the case of Figure 6, peripapillary atrophy (PPA), and the resulting hyperreflective retinal pigment epithelium, disrupted the image resolution, cpRNFL segmentation, and the retinal curvature flattening (Fig. 6A; horizontal blue arrows). OCT artifacts such as clipping of the RNFL (Fig. 6A; green arrows) and inadequate contrast (Fig. 6A & Fig. 6B; yellow arrows), similarly, had an adverse impact on both the cpRNFL segmentation and the appearance of the circular B-scan image. In any case, the outer circle scans, which were less affected, were often sufficient for the OCT specialist to classify the eye as NG or G. For example, the OCT specialist correctly classified the eye in Figure 6 as G based upon the outer circle scan’s deep local cpRNFL defects (Fig. 6B; red arrows), which were difficult to discern on the inner circle scan (Fig. 6A).
Figure 6.
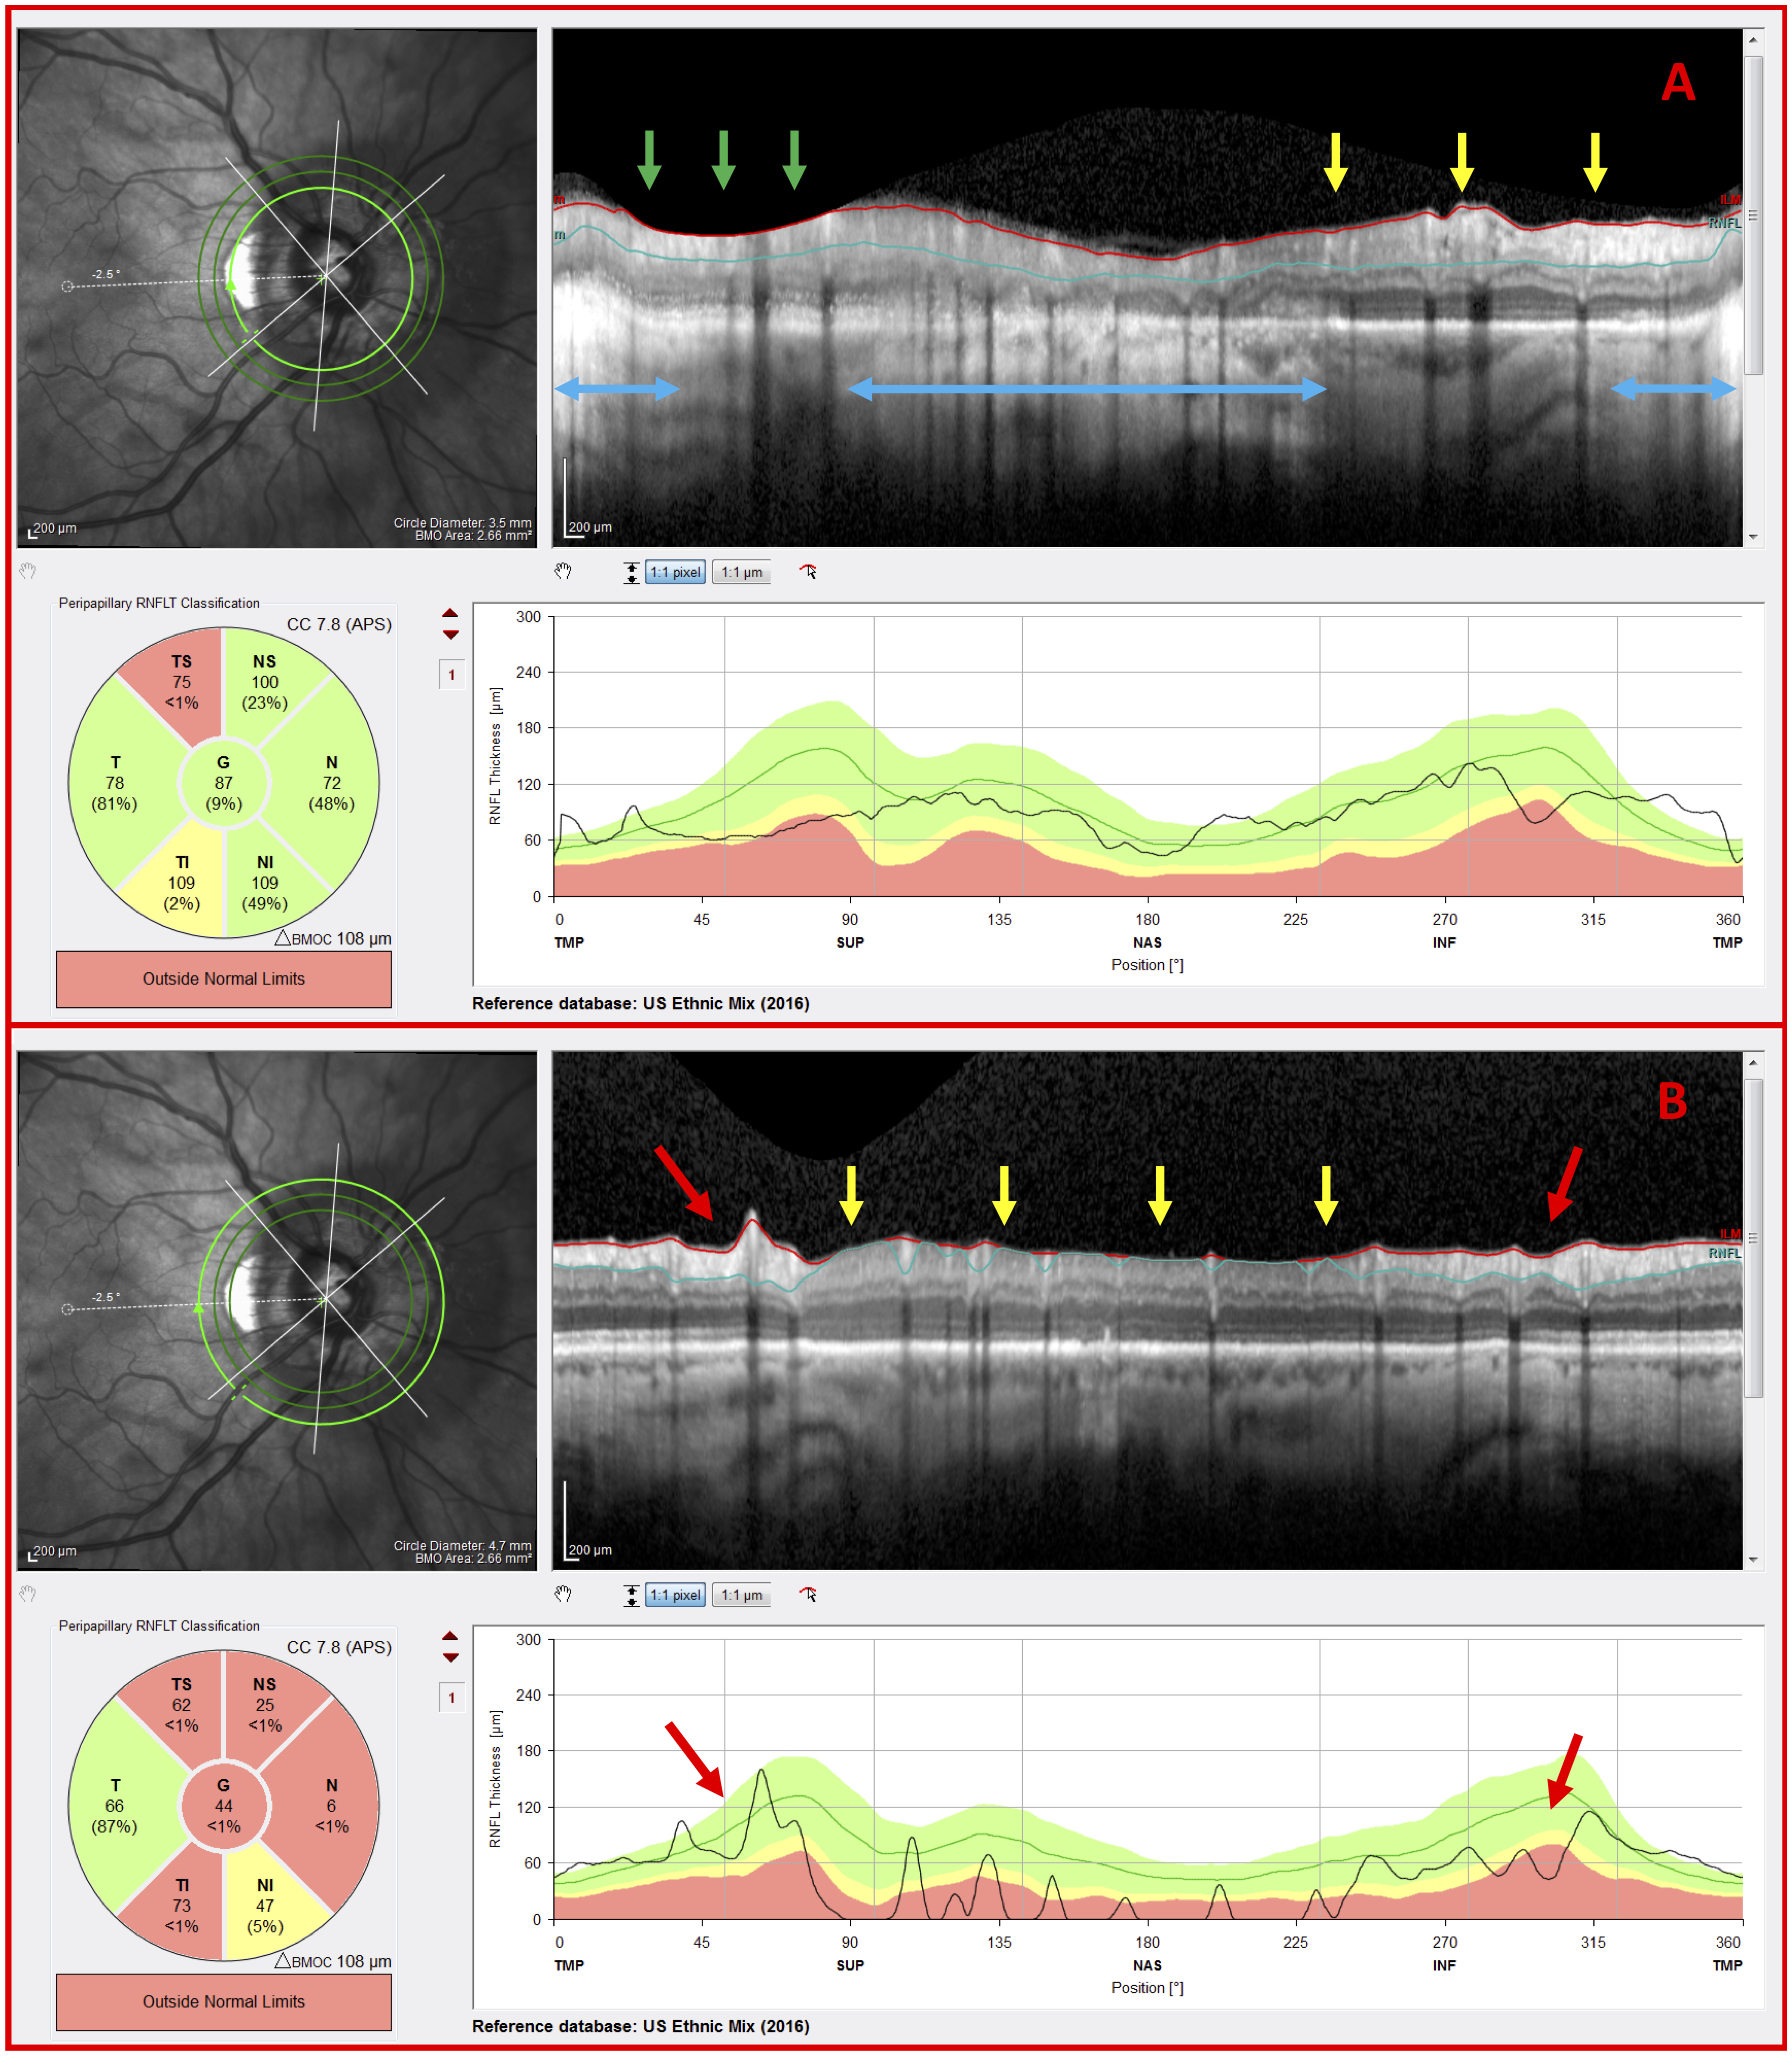
G eye with disruptive co-existing pathology and OCT artifacts (A) Inner circle scan and (B) outer circle scan of a G eye carrying peripapillary atrophy (PPA) (blue arrows), a clipping artifact (green arrows), regions of inadequate contrast (yellow arrows), and indications of glaucomatous damage (red arrows)
(+) Outer Circle Scans and Thickness Maps
In 26 out of 100 eyes, the OCT specialist requested additional OCT information beyond the circle scans. For 23 of these eyes, the OCT specialist looked at the RNFL and GCL thickness maps. The OCT specialist correctly classified 20 of these eyes as per the RS; 13 of these eyes were classified as NG and 7 as G. There were 2 false negatives (FN) and 1 false positive (FP). The correct diagnostic classifications are discussed below.
In the case of the 13 eyes correctly classified as NG, the RNFL and GCL thickness maps were used to confirm that the ostensible cpRNFL abnormality was due to high myopia-associated thinning and/or blood vessel displacement as opposed to glaucomatous RNFL thinning. As seen in Figure 7, the thick RNFL bundles (Fig. 7B) strongly suggested that the abnormal cpRNFL thickness (Fig. 7A; red arrow) was due to blood vessel placement and not glaucomatous damage. The location of the major temporal blood vessel (Fig. 7A; green arrows), relative to the peak in the normative values (Fig.7A; black arrow), caused the apparent “abnormal region” (Fig. 7A; red arrow) in this eye. Further, the OCT specialist reported that he correctly discounted the ostensible GCL thinning (Fig. 7C; red arrow) due to its proximity to the raphe (i.e. a common location for segmentation errors) and due to its lack of agreement with thinning on the projected cpRNFL location.
Figure 7.

NG eye with potential glaucomatous thinning (A) Inner circle scan, (B) RNFL thickness map, and (C) GCL thickness map of an H eye carrying potential glaucomatous temporal superior (TS) cpRNFL thinning (red arrow), but otherwise thick RNFL bundles
In the case of 6 of the 7 eyes correctly classified as G, the RNFL and GCL thickness maps were used to confirm that subtle cpRNFL thinning was associated with arcuate damage. As seen in Figure 8, the localized GCL thinning (Fig. 8C; red arrow) corresponded to the subtle temporal inferior (TI) RNFL thinning (Fig. 8A & Fig. 8B; red arrows). In this example, the cpRNFL damage was distinguished from thinning associated with high myopia and/or blood vessel displacement based upon the thickness maps.
Figure 8.
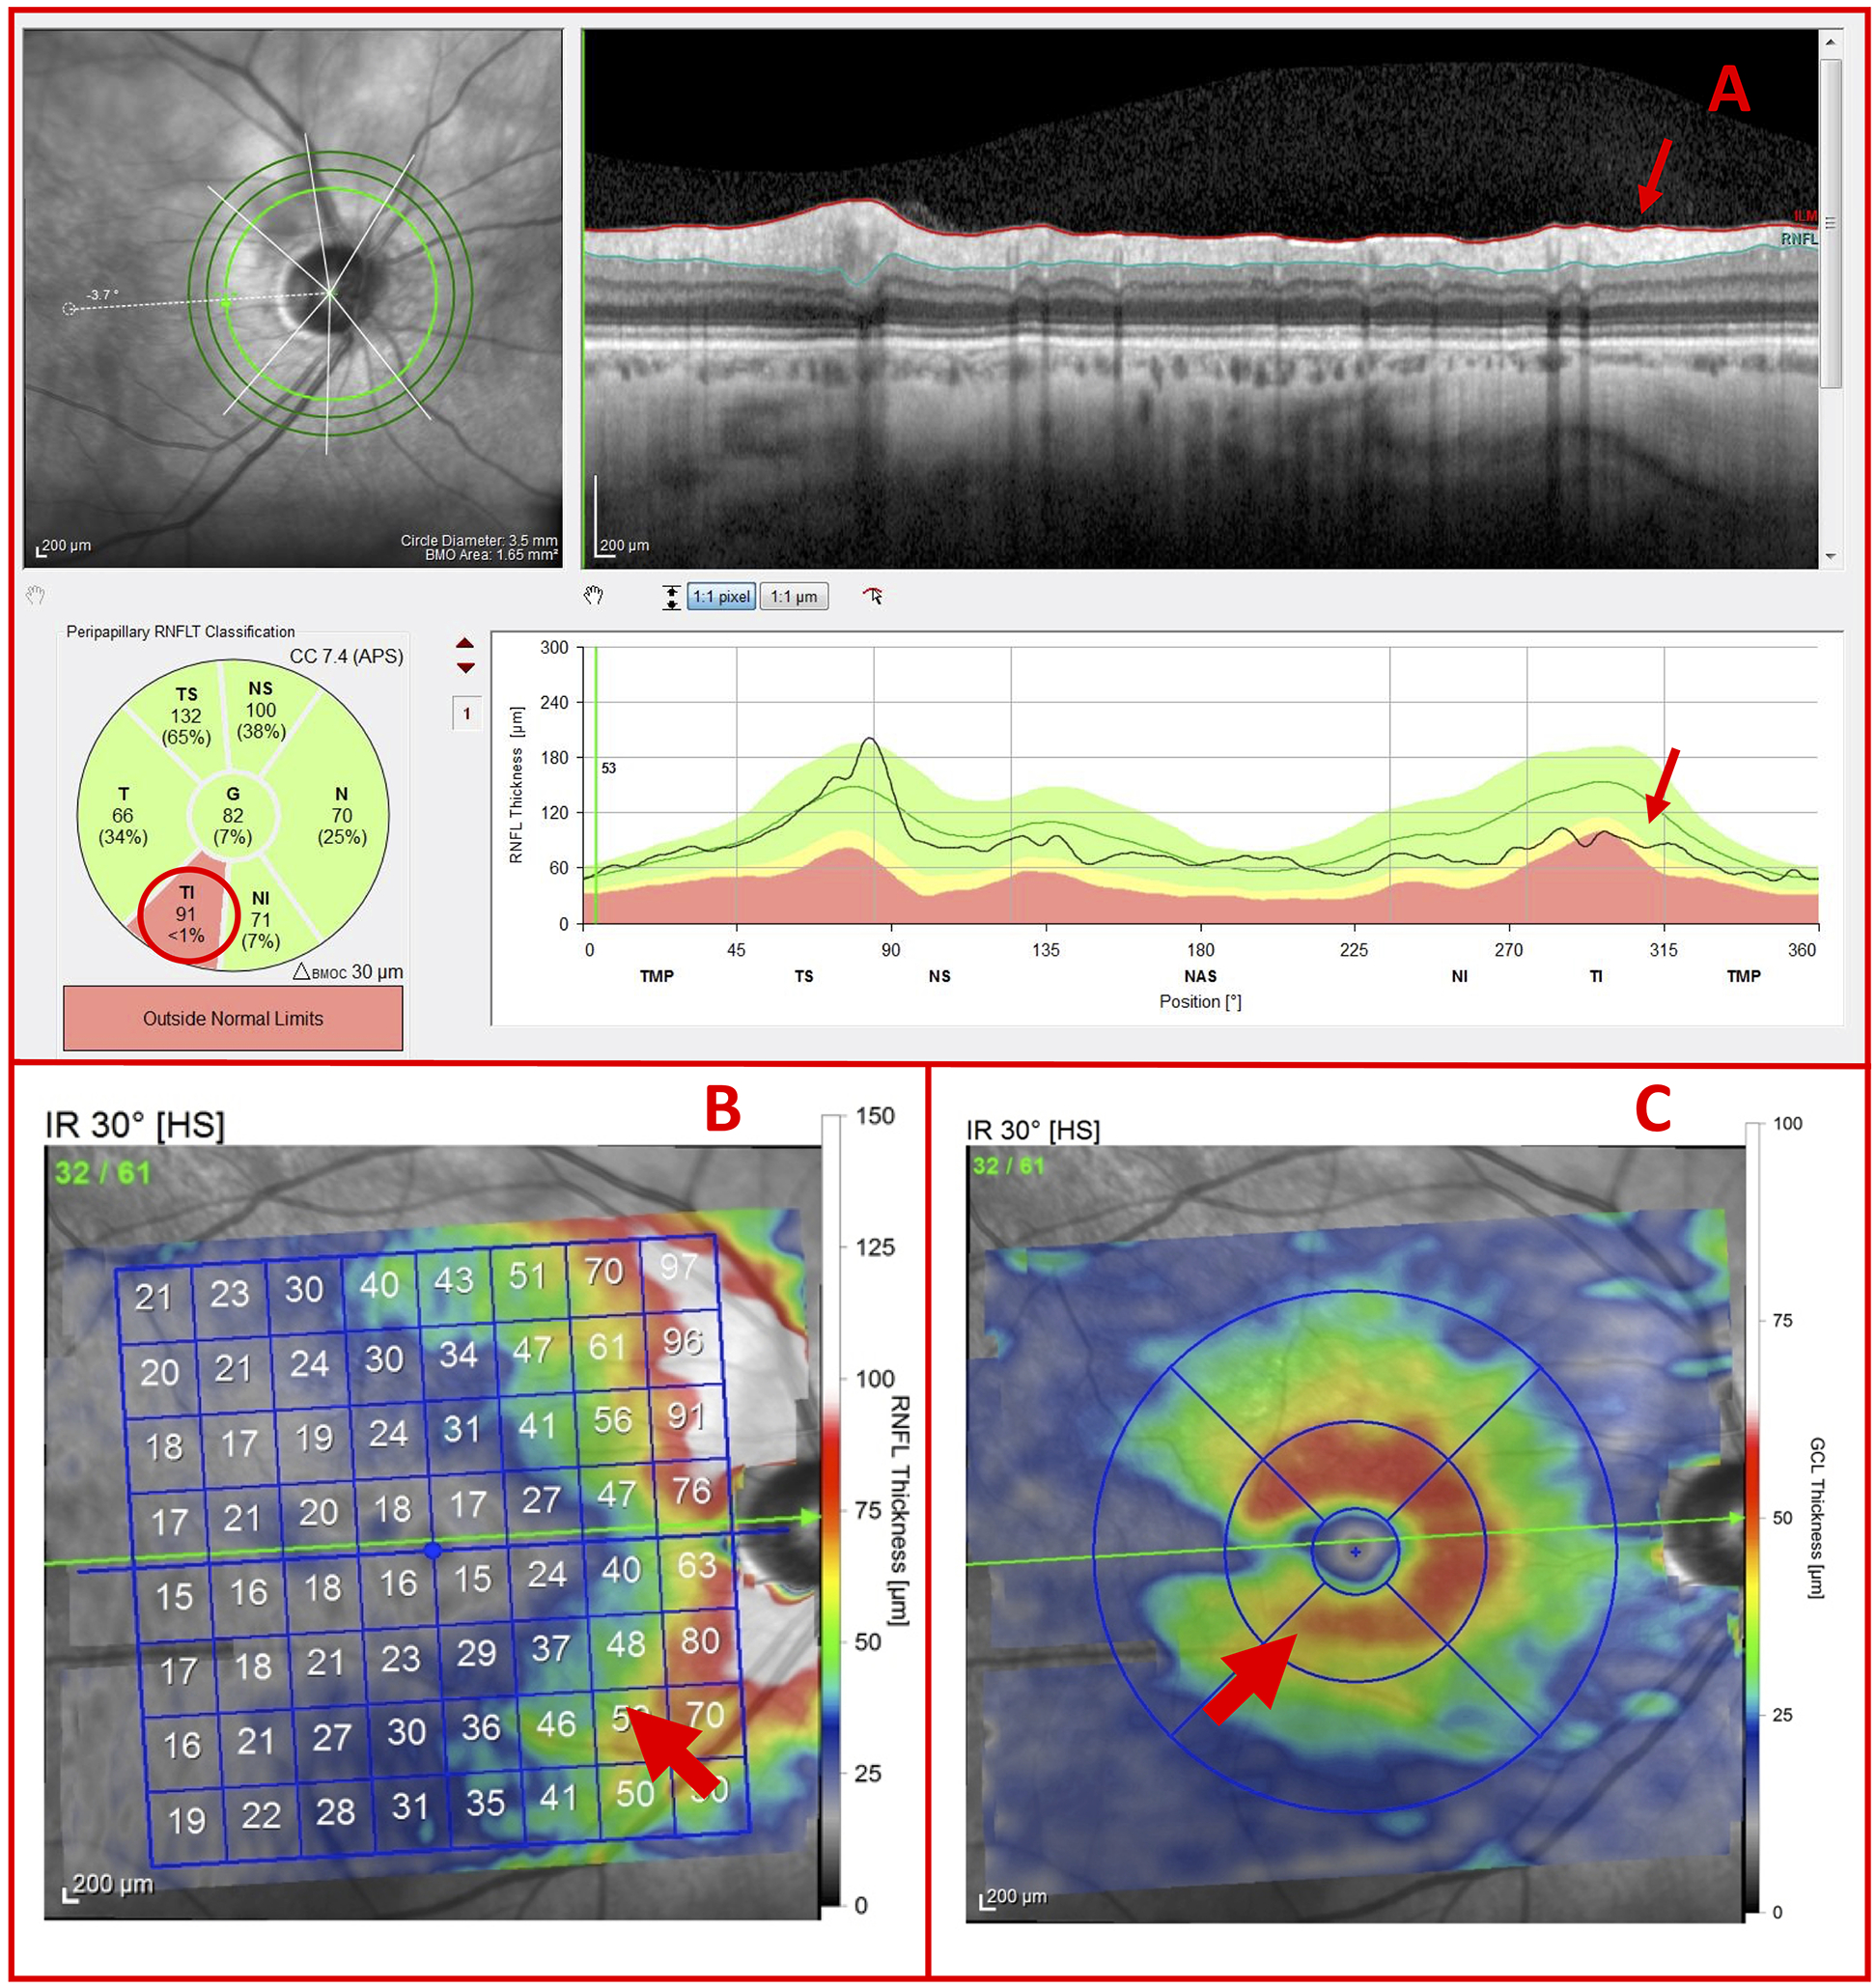
G eye with potential glaucomatous thinning (A) Inner circle scan, (B) RNFL thickness map, and (C) GCL thickness map of a G Eye carrying subtle glaucomatous temporal inferior (TI) RNFL thinning and localized GCL thinning (red arrows)
For one of the 7 eyes correctly classified as G, the contrast of all 3 circle scans was poor. As a result, the commercial cpRNFL segmentation algorithm performed poorly in regions (Fig. 9A; yellow arrows) such as that adjacent to the possible TI thinning of the cpRNFL (Fig. 9A; red arrows). This location of possible thinning corresponded to the localized GCL thinning (Fig. 9C; red arrow) and the corresponding RNFL thinning around the inferior blood vessel (Fig. 9B; red arrow). Based upon this pattern of damage, the OCT specialist correctly classified the eye as glaucomatous.
Figure 9.
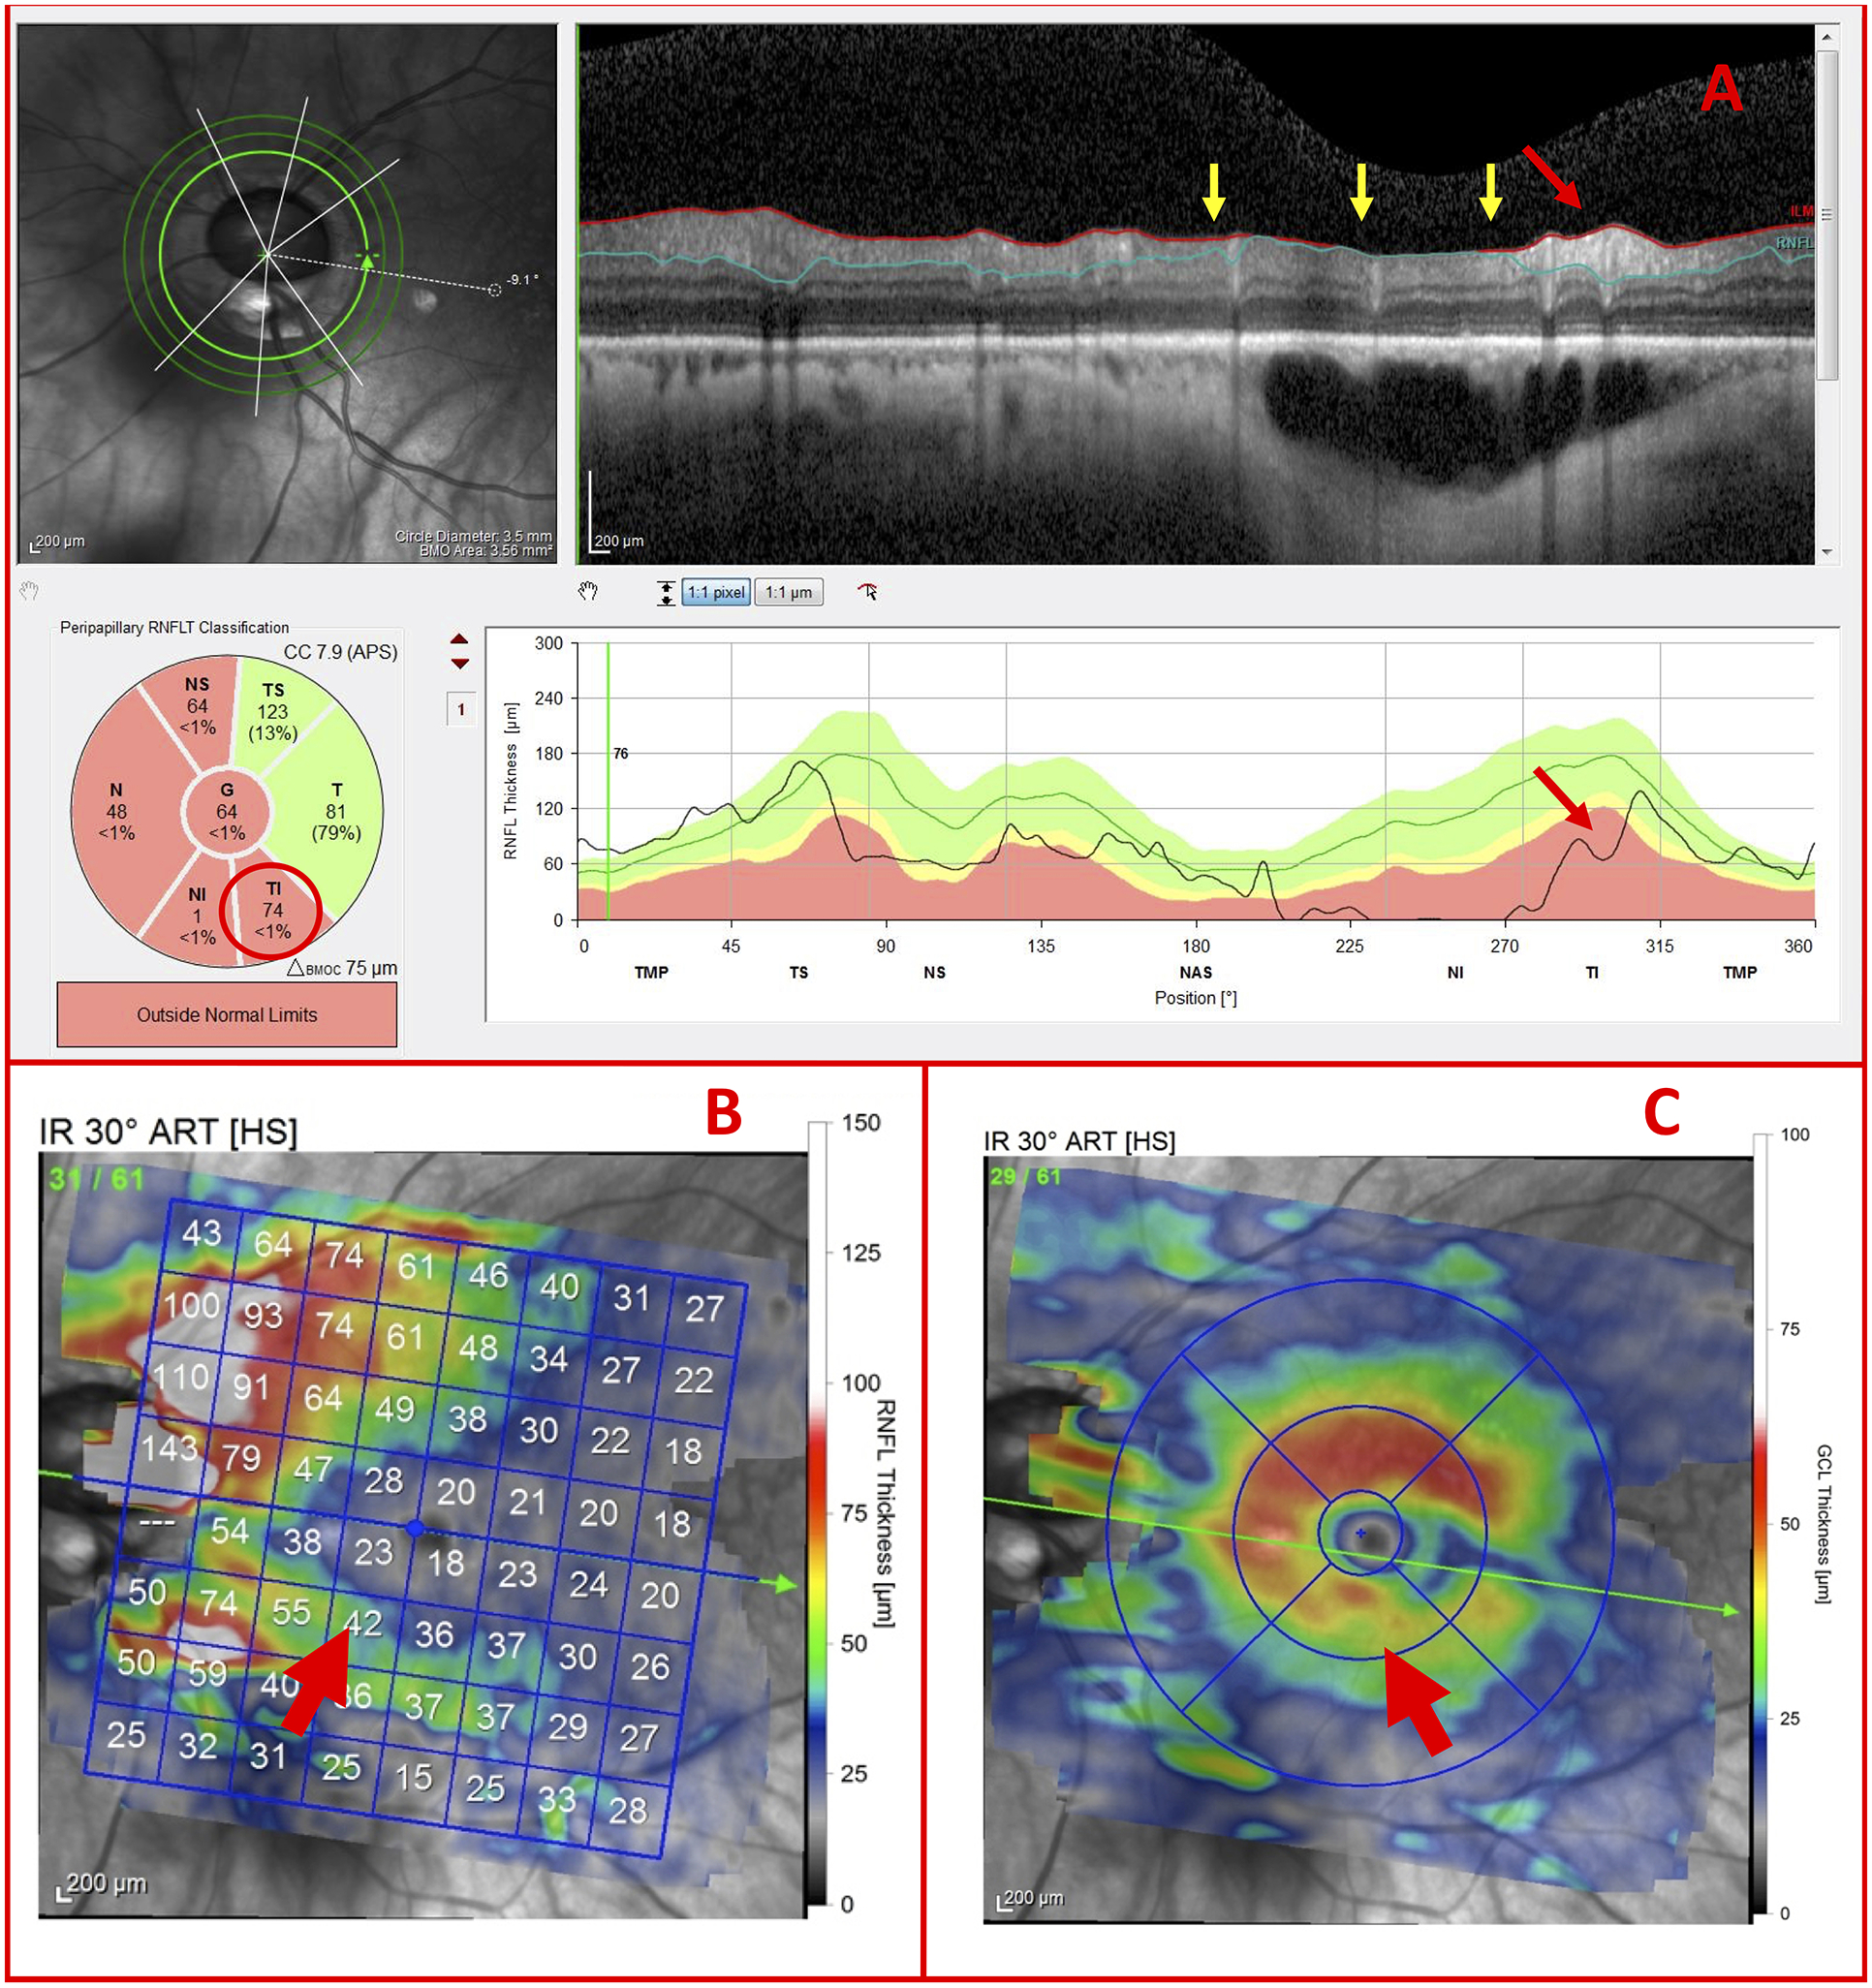
OCT artifacts necessitate use of thickness maps (A) Inner circle scan, (B) RNFL thickness map, and (C) GCL thickness map of a G Eye carrying a region of inadequate contrast (yellow arrows), as well as indications of glaucomatous damage (red arrows)
(+) Outer Circle Scans, Thickness Maps, and B-scans
Finally, in 3 out of 100 eyes, the OCT specialist looked at the horizontal and/or vertical b-scans, as well as the thickness maps and inner and outer circles scans. All 3 eyes were correctly classified as G.
In the case of Figure 10, the OCT specialist reported difficulty in determining whether the temporal thinning in the cpRNFL (Fig. 10A; red arrows) was the result of glaucomatous damage or high myopia-associated thinning and/or blood vessel displacement. The OCT specialist correctly assigned a classification of G to the eye based on the GCL thinning (Fig. 10C), as well as the RNFL thinning as shown on the vertical meridian B-scan (Fig. 10D; red arrows). Independently, these observations would likely have been insufficient, but, together, the pattern appeared to be more indicative of G than NG.35 Note: The glaucoma specialist also noted the following: IOP Max (21 mmHg), CDR (0.7), and pigment dispersion syndrome.
Figure 10.
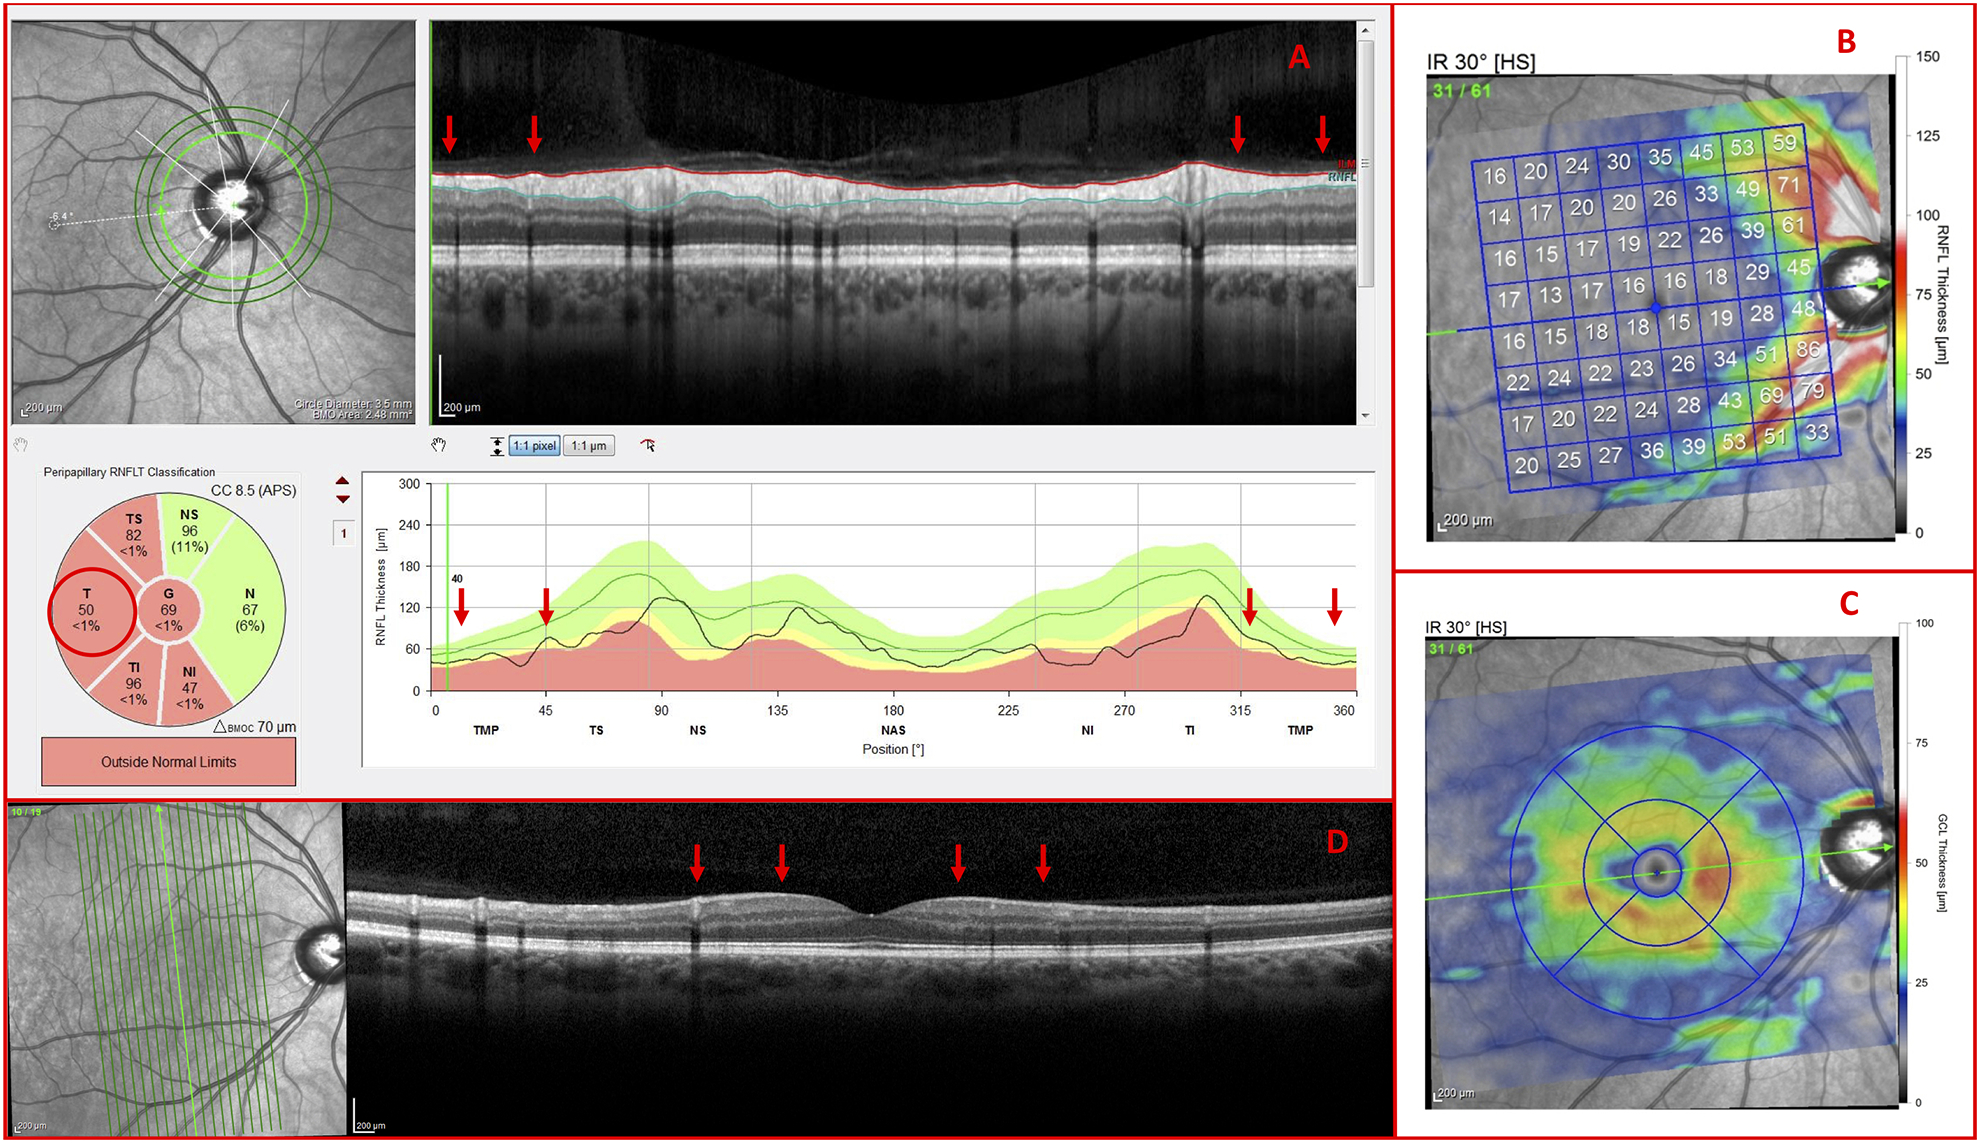
Vertical b-scans verify glaucomatous thinning (A) Inner circle scan, (B) RNFL thickness map, (C) GCL thickness map, and (D) vertical meridian b-scan of a G Eye carrying glaucomatous temporal (T) RNFL thinning (red arrows) and GCL thinning
In the other 2 cases, the commercial software incorrectly centered the circle scans due to PPA and the OCT technician failed to correct the centering (Fig. 11A). As such, the circle scans could not be interpreted. Further, epiretinal membranes rendered the RNFL thickness map unreadable (Fig. 11B) so the OCT specialist asked to inspect the RNFL on the vertical B-scans to identify RNFL thinning. The inferior RNFL thinning (Fig. 11D; red arrows) corresponded to clear inferior GCL thinning on the GCL thickness maps (Fig. 11C; red arrow). Based upon this pattern of damage, the OCT specialist correctly classified the eye as glaucomatous.
Figure 11.
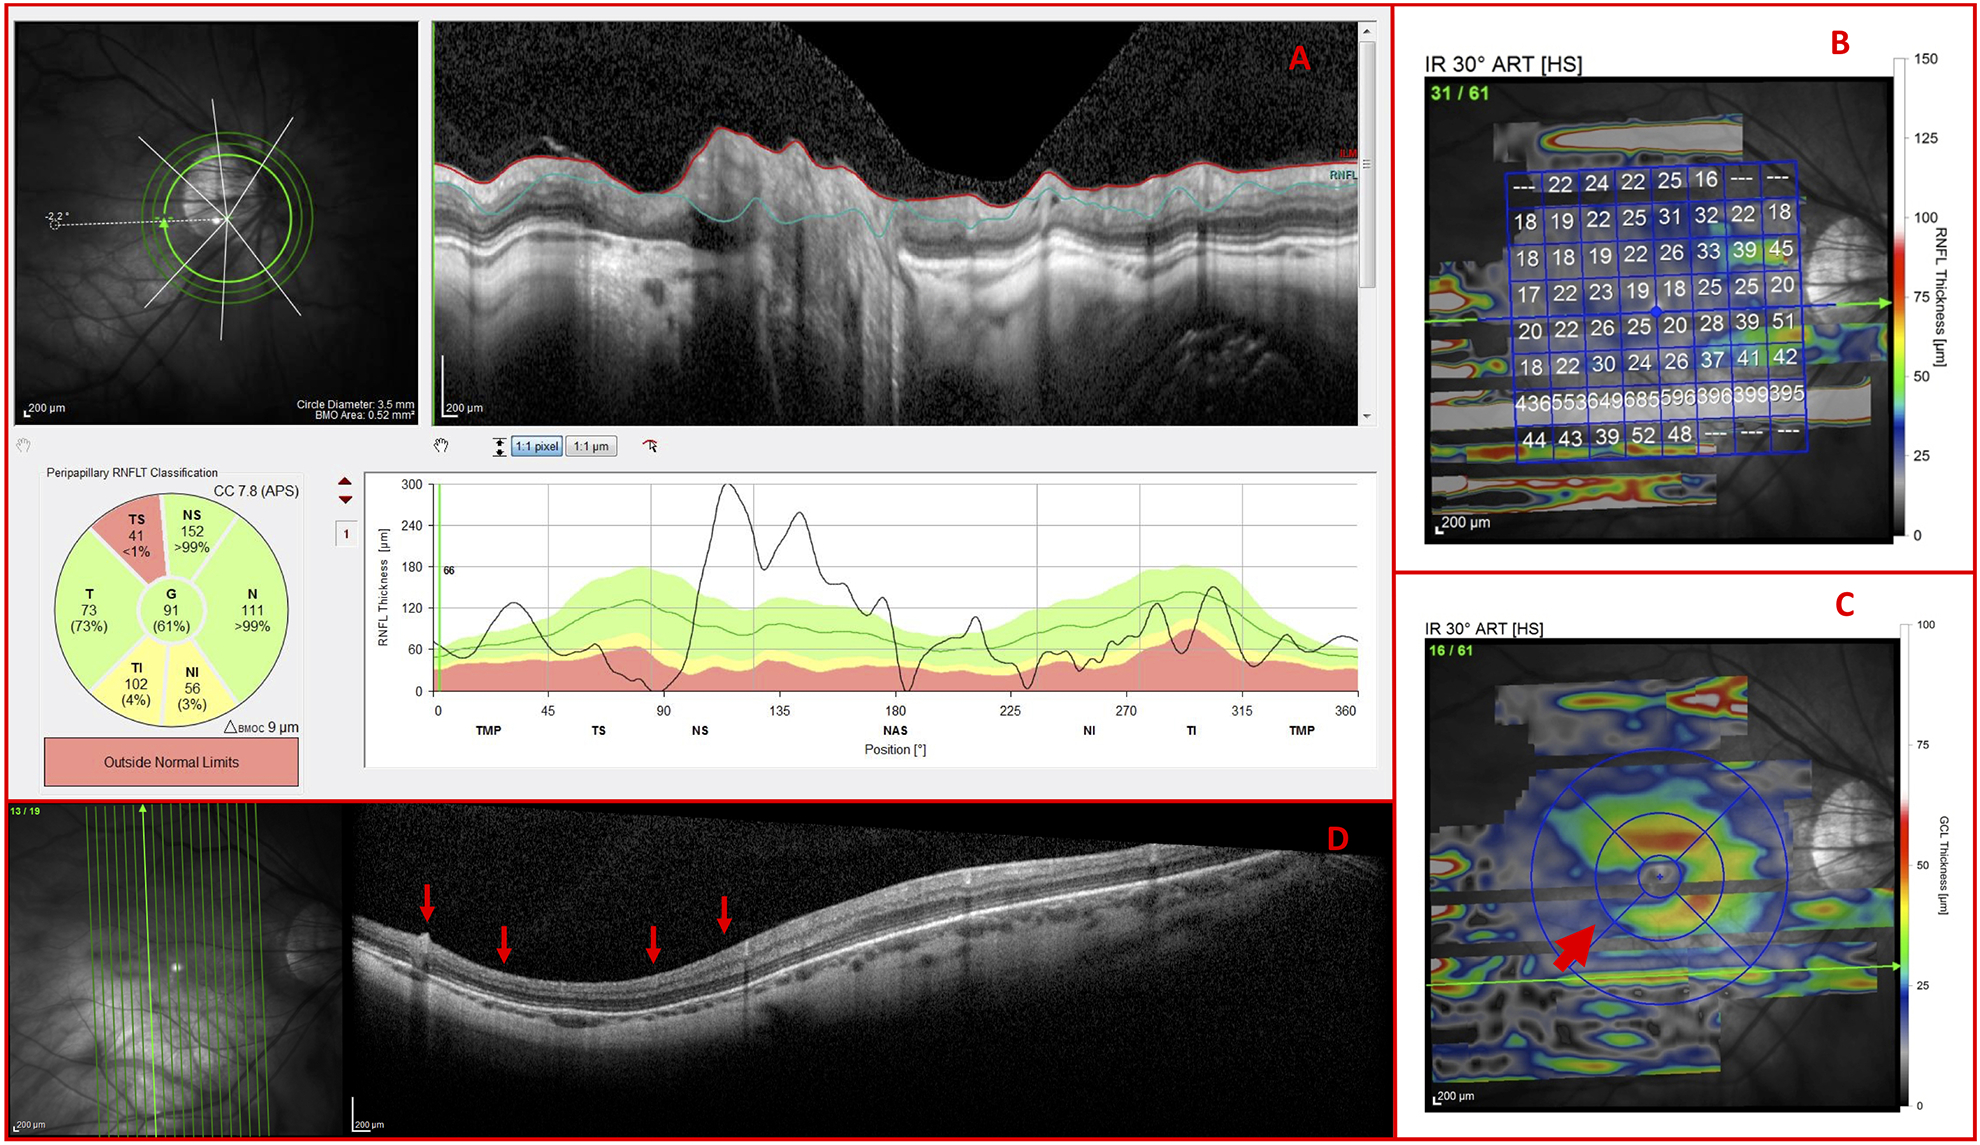
Co-existing pathologies necessitate use of vertical b-scans (A) Incorrectly centered circle scan, (B) RNFL thickness map disrupted by epiretinal membranes, (C) GCL thickness map, and (D) vertical b-scan of a G Eye carrying indications of glaucomatous damage (red arrows)
Co-existing Ophthalmic Pathologies
As seen in Table 3, 81% of the eyes had one or more of the following co-existing ophthalmic pathologies: peripapillary atrophy (PPA), epiretinal membrane (ERM), tilted disc (TD), and paravascular inner retinal defect (PIRD). PPA most necessitated the use of additional OCT information, followed by ERMs, PIRDs, and TDs. In addition, PPA was the most common co-existing ophthalmic pathology, followed by TDs, PIRDs, and ERMs.
Table 3.
Prevalence of Co-existing Ophthalmic Pathologies
| Factor | Total NG (# of Eyes) | Total G (# of Eyes) | Total (# of Eyes) |
|---|---|---|---|
| PPA | 27 | 52 | 79 |
| ERM | 4 | 14 | 18 |
| PIRD | 7 | 21 | 28 |
| TD | 17 | 31 | 48 |
| NONE | 8 | 11 | 19 |
| Total | 36 | 64 | 100 |
Discussion
The purpose of this study was to test the hypothesis as to whether or not it is possible to diagnose GON in high myopes via an assessment of the OCT results. 97% of the eyes were correctly classified as either non-glaucomatous or glaucomatous using only the current commercial OCT reports and scans. In 63% of the cases, the inner circle scan report alone was sufficient for an OCT specialist to correctly classify the eyes. According to the OCT specialist, the additional reports and scans were not always strictly necessary, but typically increased the OCT specialist’s confidence in his classification. Thus, a proposed single diagnostic report,13,14,19,24 which includes the circles scan and RNFL and GCL thickness maps, would have allowed correct assessment of the OCT information in at least 94 of the 97 eyes correctly classified.
In short, we are concluding that OCT scans, and the reports used here, have sufficient information to be used to diagnose glaucoma in most eyes with high myopia. On the other hand, this study does not speak to whether others can be trained to do as well as the OCT specialist. Similarly, we previously showed that a single-page OCT report, with the same maps and scan images used in the current study, had the information needed to diagnose early glaucoma (i.e. eyes with 24–2 MD better than −6 dB). In particular, the same OCT specialist showed 98% agreement with a reference standard consisting of 57 eyes judged as glaucomatous/probably glaucomatous and 45 eyes judged as healthy/probably healthy by two glaucoma specialists. These specialists were not trained by the OCT specialist. In that paper, we mention that we had previously shown that two premedical students and two young glaucoma specialists could be trained to do well in diagnosing early glaucoma on a similar data set (Hood DC et al. IOVS 2015;56:ARVO E-Abstract 2060). In any case, future studies will need to document that others can be trained to use OCT scans to diagnose glaucoma in eyes with high myopia.
Of course, as in all studies evaluating diagnostic ability, the performance of the OCT specialist, 97% accuracy in the current study, is dependent upon the reference standard used for comparison. Agreement certainly would have been poorer had we defined “glaucoma” based upon visual field metrics such as abnormal pattern standard deviation (PSD) and glaucoma hemifield test (GHT) of the 24–2 test, or based upon defects seen on fundus photographs. But, reference standards based upon these metrics miss glaucomatous damage.13,14 Instead, we chose as our reference standard a glaucoma specialist who was experienced in reading OCT reports and looking closely at the b-scan images. Had we instead used someone less experienced with OCT images, or someone who only looked at metrics like OCT cpRNFL global or sectoral thickness, then the agreement would not have been as good. Thus, we are not saying that clinicians looking at the OCT reports of high myopes will agree with other clinicians looking at the same reports plus other clinical information. We are saying that the information is there in OCT reports to be clinically useful. Of course, this study needs replicating with different OCT instruments, different populations of high myopes, as well as different reference standards mentioned below.
In addition, as suggested,30–32 a high myopia normative database for the cpRNFL thickness plot, as well as for the RNFL and GCL thickness maps, may help facilitate faster and more confident diagnoses. In 36% of the non-glaucomatous eyes and 11% of the glaucomatous eyes, the OCT specialist needed more information than available in the inner circle scan report to distinguish between high myopia-associated thinning and/or blood vessel displacement, on one hand, and glaucomatous cpRNFL thinning, on the other. A high myopia normative database may help mitigate these factors related to high myopia. In fact, some groups have already demonstrated that high myopia normative databases can decrease the rate of misdiagnosis for glaucoma.36,37
In any case, a high myopia normative database is not a panacea for all high myopia-associated OCT issues. OCT scans from high myopes are generally susceptible to aliasing artifacts, undesired cropping, inadequate contrast, and poor image resolution which can produce high rates of retinal segmentation error.7,38,39 The OCT specialist, in our study, requested additional OCT information for 13% of the eyes, in part, as a result of high myopia-associated artifacts. Additionally, common co-existing ophthalmic pathologies of the optic disc in high myopes, such as tilting and peripapillary atrophy, can disrupt the disc margins and acquisition signal levels, resulting in errors in the automated cpRNFL thickness measurement software, which will still result in errors in the summary metrics (Fig. 1C), even with a myopia normative group.8 Macular abnormalities, such as foveoschisis and ERM, are also relatively common in eyes with high myopia and can complicate the RNFL and GCL thickness and probability maps, as well as the associated summary metrics.3 In our high myope group, for example, 81% of the eyes had one or more of the subsequent co-existing ophthalmic pathologies: PPA, ERM, TD, and/or a PIRD. Because ERMs and PIRDs can mimic the effects of glaucoma, there is a critical need to better understand the role these factors play in highly myopic eyes of patients with and without glaucoma.33,40
In conclusion, there are at least three clinical implications. First, in principle, it should be possible to train clinicians to better use OCT scans for diagnosing glaucoma in eyes with high myopia. Although this study was not designed as a training manual, the examples presented may be useful toward that end. Second, it may be possible to develop artificial intelligence or deep learning methods to perform as well or better than the OCT specialist. Finally, an assessment of the OCT scans from eyes with high myopia can be used to detect GON without a high myopia normative group. While a high myopia normative database may help the clinician, this alone will not allow the clinician to overcome the various factors affecting the OCT data from high myopes. The optimal use of the OCT will also depend upon visual inspection of the b-scans, as well as cpRNFL plots, and RNFL and GCL thickness maps. Nevertheless, there exists a need to better understand the effects of co-existing ophthalmic pathologies, particularly ERMs and PIRDs, on OCT scans, as there is a danger of these factors masquerading as glaucomatous damage.
Acknowledgments
NIH/NEI Grants RO1-EY‐02115
References
- 1.Weinreb RN, Leung CK, Crowston JG, et al. Primary open-angle glaucoma. Nat Rev Dis Primers. 2016;2:16067. [DOI] [PubMed] [Google Scholar]
- 2.Seo S, Lee CE, Jeong JH, Park KH, Kim DM, Jeoung JW. Ganglion cell-inner plexiform layer and retinal nerve fiber layer thickness according to myopia and optic disc area: a quantitative and three-dimensional analysis. BMC Ophthalmol. 2017;17(1):22. [DOI] [PMC free article] [PubMed] [Google Scholar]
- 3.Henaine-Berra A, Zand-Hadas IM, Fromow-Guerra J, Garcia-Aguirre G. Prevalence of macular anatomic abnormalities in high myopia. Ophthalmic Surg Lasers Imaging Retina. 2013;44(2):140–144. [DOI] [PubMed] [Google Scholar]
- 4.Liu W, Gong L, Li Y, Zhu X, Stewart JM, Wang C. Peripapillary Atrophy in High Myopia. Curr Eye Res. 2017;42(9):1308–1312. [DOI] [PubMed] [Google Scholar]
- 5.Muraoka Y, Tsujikawa A, Hata M, et al. Paravascular inner retinal defect associated with high myopia or epiretinal membrane. JAMA Ophthalmol. 2015;133(4):413–420. [DOI] [PubMed] [Google Scholar]
- 6.Leung CK, Cheng AC, Chong KK, et al. Optic disc measurements in myopia with optical coherence tomography and confocal scanning laser ophthalmoscopy. Invest Ophthalmol Vis Sci. 2007;48(7):3178–3183. [DOI] [PubMed] [Google Scholar]
- 7.Suwan Y, Rettig S, Park SC, et al. Effects of Circumpapillary Retinal Nerve Fiber Layer Segmentation Error Correction on Glaucoma Diagnosis in Myopic Eyes. J Glaucoma. 2018;27(11):971–975. [DOI] [PubMed] [Google Scholar]
- 8.Tong L, Chan YH, Gazzard G, et al. Heidelberg retinal tomography of optic disc and nerve fiber layer in singapore children: variations with disc tilt and refractive error. Invest Ophthalmol Vis Sci. 2007;48(11):4939–4944. [DOI] [PubMed] [Google Scholar]
- 9.Sharma P, Sample PA, Zangwill LM, Schuman JS. Diagnostic tools for glaucoma detection and management. Surv Ophthalmol. 2008;53 Suppl1:S17–32. [DOI] [PMC free article] [PubMed] [Google Scholar]
- 10.Wollstein G, Schuman JS, Price LL, et al. Optical coherence tomography longitudinal evaluation of retinal nerve fiber layer thickness in glaucoma. Arch Ophthalmol. 2005;123(4):464–470. [DOI] [PMC free article] [PubMed] [Google Scholar]
- 11.Costa RA, Skaf M, Melo LA Jr., et al. Retinal assessment using optical coherence tomography. Prog Retin Eye Res. 2006;25(3):325–353. [DOI] [PubMed] [Google Scholar]
- 12.van Velthoven ME, Faber DJ, Verbraak FD, van Leeuwen TG, de Smet MD. Recent developments in optical coherence tomography for imaging the retina. Prog Retin Eye Res. 2007;26(1):57–77. [DOI] [PubMed] [Google Scholar]
- 13.Hood DC, De Moraes CG. Challenges to the Common Clinical Paradigm for Diagnosis of Glaucomatous Damage With OCT and Visual Fields. Invest Ophthalmol Vis Sci. 2018;59(2):788–791. [DOI] [PMC free article] [PubMed] [Google Scholar]
- 14.Hood DC. Improving our understanding, and detection, of glaucomatous damage: An approach based upon optical coherence tomography (OCT). Prog Retin Eye Res. 2017;57:46–75. [DOI] [PMC free article] [PubMed] [Google Scholar]
- 15.Kang SH, Hong SW, Im SK, Lee SH, Ahn MD. Effect of myopia on the thickness of the retinal nerve fiber layer measured by Cirrus HD optical coherence tomography. Invest Ophthalmol Vis Sci. 2010;51(8):4075–4083. [DOI] [PubMed] [Google Scholar]
- 16.Kim MJ, Lee EJ, Kim TW. Peripapillary retinal nerve fibre layer thickness profile in subjects with myopia measured using the Stratus optical coherence tomography. Br J Ophthalmol. 2010;94(1):115–120. [DOI] [PubMed] [Google Scholar]
- 17.Yamashita T, Kii Y, Tanaka M, et al. Relationship between supernormal sectors of retinal nerve fibre layer and axial length in normal eyes. Acta Ophthalmol. 2014;92(6):e481–487. [DOI] [PubMed] [Google Scholar]
- 18.Chong GT, Lee RK. Glaucoma versus red disease: imaging and glaucoma diagnosis. Curr Opin Ophthalmol. 2012;23(2):79–88. [DOI] [PubMed] [Google Scholar]
- 19.Hood DC, Raza AS. Method for comparing visual field defects to local RNFL and RGC damage seen on frequency domain OCT in patients with glaucoma. Biomedical optics express. 2011;2(5):1097–1105. [DOI] [PMC free article] [PubMed] [Google Scholar]
- 20.Malakar M, Askari SN, Ashraf H, Waris A, Ahuja A, Asghar A. Optical coherence tomography assisted retinal nerve fibre layer thickness profile in high myopia. J Clin Diagn Res. 2015;9(2):NC01–NC03. [DOI] [PMC free article] [PubMed] [Google Scholar]
- 21.Singh D, S KM, Agarwal E, Sharma R, Bhartiya S, Dada T. Assessment of Retinal Nerve Fiber Layer Changes by Cirrus High-definition Optical Coherence Tomography in Myopia. J Curr Glaucoma Pract. 2017;11(2):52–57. [DOI] [PMC free article] [PubMed] [Google Scholar]
- 22.AttaAllah HR, Omar IAN, Abdelhalim AS. Evaluation of Optic Nerve Head Parameters and Retinal Nerve Fiber Layer Thickness in Axial Myopia Using SD OCT. Ophthalmol Ther. 2017;6(2):335–341. [DOI] [PMC free article] [PubMed] [Google Scholar]
- 23.Leung CK, Yu M, Weinreb RN, et al. Retinal nerve fiber layer imaging with spectral-domain optical coherence tomography: interpreting the RNFL maps in healthy myopic eyes. Invest Ophthalmol Vis Sci. 2012;53(11):7194–7200. [DOI] [PubMed] [Google Scholar]
- 24.Hood DC, Raza AS, de Moraes CG, Liebmann JM, Ritch R. Glaucomatous damage of the macula. Prog Retin Eye Res. 2013;32:1–21. [DOI] [PMC free article] [PubMed] [Google Scholar]
- 25.Hood DC, Raza AS. On improving the use of OCT imaging for detecting glaucomatous damage. Br J Ophthalmol. 2014;98 Suppl 2:ii1–9. [DOI] [PMC free article] [PubMed] [Google Scholar]
- 26.Hood DC, De Cuir N, Blumberg DM, et al. A single wide-field OCT protocol can provide compelling information for the diagnosis of early glaucoma. Translational vision science & technology. 2016;5(6):4–4. [DOI] [PMC free article] [PubMed] [Google Scholar]
- 27.Bhagat PR, Deshpande KV, Natu B. Utility of Ganglion Cell Complex Analysis in Early Diagnosis and Monitoring of Glaucoma using a Different Spectral Domain Optical Coherence Tomography. J Curr Glaucoma Pract. 2014;8(3):101–106. [DOI] [PMC free article] [PubMed] [Google Scholar]
- 28.Choi YJ, Jeoung JW, Park KH, Kim DM. Glaucoma detection ability of ganglion cell-inner plexiform layer thickness by spectral-domain optical coherence tomography in high myopia. Invest Ophthalmol Vis Sci. 2013;54(3):2296–2304. [DOI] [PubMed] [Google Scholar]
- 29.Koh VT, Tham YC, Cheung CY, et al. Determinants of ganglion cell-inner plexiform layer thickness measured by high-definition optical coherence tomography. Invest Ophthalmol Vis Sci. 2012;53(9):5853–5859. [DOI] [PubMed] [Google Scholar]
- 30.Schuman JS. Optical Coherence Tomography in High Myopia. JAMA ophthalmology. 2016;134(9):1040–1040. [DOI] [PMC free article] [PubMed] [Google Scholar]
- 31.Akashi A, Kanamori A, Ueda K, Inoue Y, Yamada Y, Nakamura M. The Ability of SD-OCT to Differentiate Early Glaucoma With High Myopia From Highly Myopic Controls and Nonhighly Myopic Controls. Invest Ophthalmol Vis Sci. 2015;56(11):6573–6580. [DOI] [PubMed] [Google Scholar]
- 32.Chen HS, Liu CH, Lu DW. Comparison of glaucoma diagnostic accuracy of macular ganglion cell complex thickness based on nonhighly myopic and highly myopic normative database. Taiwan J Ophthalmol. 2016;6(1):15–20. [DOI] [PMC free article] [PubMed] [Google Scholar]
- 33.Mavrommatis MA, De Cuir N, Reynaud J, et al. An Examination of the Frequency of Paravascular Defects and Epiretinal Membranes in Eyes With Early Glaucoma Using En-face Slab OCT Images. J Glaucoma. 2019;28(3):265–269. [DOI] [PMC free article] [PubMed] [Google Scholar]
- 34.Hood DC, Fortune B, Arthur SN, et al. Blood vessel contributions to retinal nerve fiber layer thickness profiles measured with optical coherence tomography. Journal of glaucoma. 2008;17(7):519. [DOI] [PMC free article] [PubMed] [Google Scholar]
- 35.Hood DC, Slobodnick A, Raza AS, de Moraes CG, Teng CC, Ritch R. Early glaucoma involves both deep local, and shallow widespread, retinal nerve fiber damage of the macular region. Invest Ophthalmol Vis Sci. 2014;55(2):632–649. [DOI] [PMC free article] [PubMed] [Google Scholar]
- 36.Biswas S, Lin C, Leung CK. Evaluation of a Myopic Normative Database for Analysis of Retinal Nerve Fiber Layer Thickness. JAMA Ophthalmol. 2016;134(9):1032–1039. [DOI] [PubMed] [Google Scholar]
- 37.Nakanishi H, Akagi T, Hangai M, et al. Sensitivity and specificity for detecting early glaucoma in eyes with high myopia from normative database of macular ganglion cell complex thickness obtained from normal non-myopic or highly myopic Asian eyes. Graefes Arch Clin Exp Ophthalmol. 2015;253(7):1143–1152. [DOI] [PubMed] [Google Scholar]
- 38.Faghihi H, Hajizadeh F, Riazi-Esfahani M. Optical coherence tomographic findings in highly myopic eyes. J Ophthalmic Vis Res. 2010;5(2):110–121. [PMC free article] [PubMed] [Google Scholar]
- 39.Ho J, Castro DPE, Castro LC, et al. Clinical assessment of mirror artifacts in spectral-domain optical coherence tomography. Investigative ophthalmology & visual science. 2010;51(7):3714–3720. [DOI] [PMC free article] [PubMed] [Google Scholar]
- 40.Hood DC, De Cuir N, Mavrommatis MA, et al. Defects Along Blood Vessels in Glaucoma Suspects and Patients. Investigative ophthalmology & visual science. 2016;57(4):1680–1686. [DOI] [PMC free article] [PubMed] [Google Scholar]


