
Figure 1.
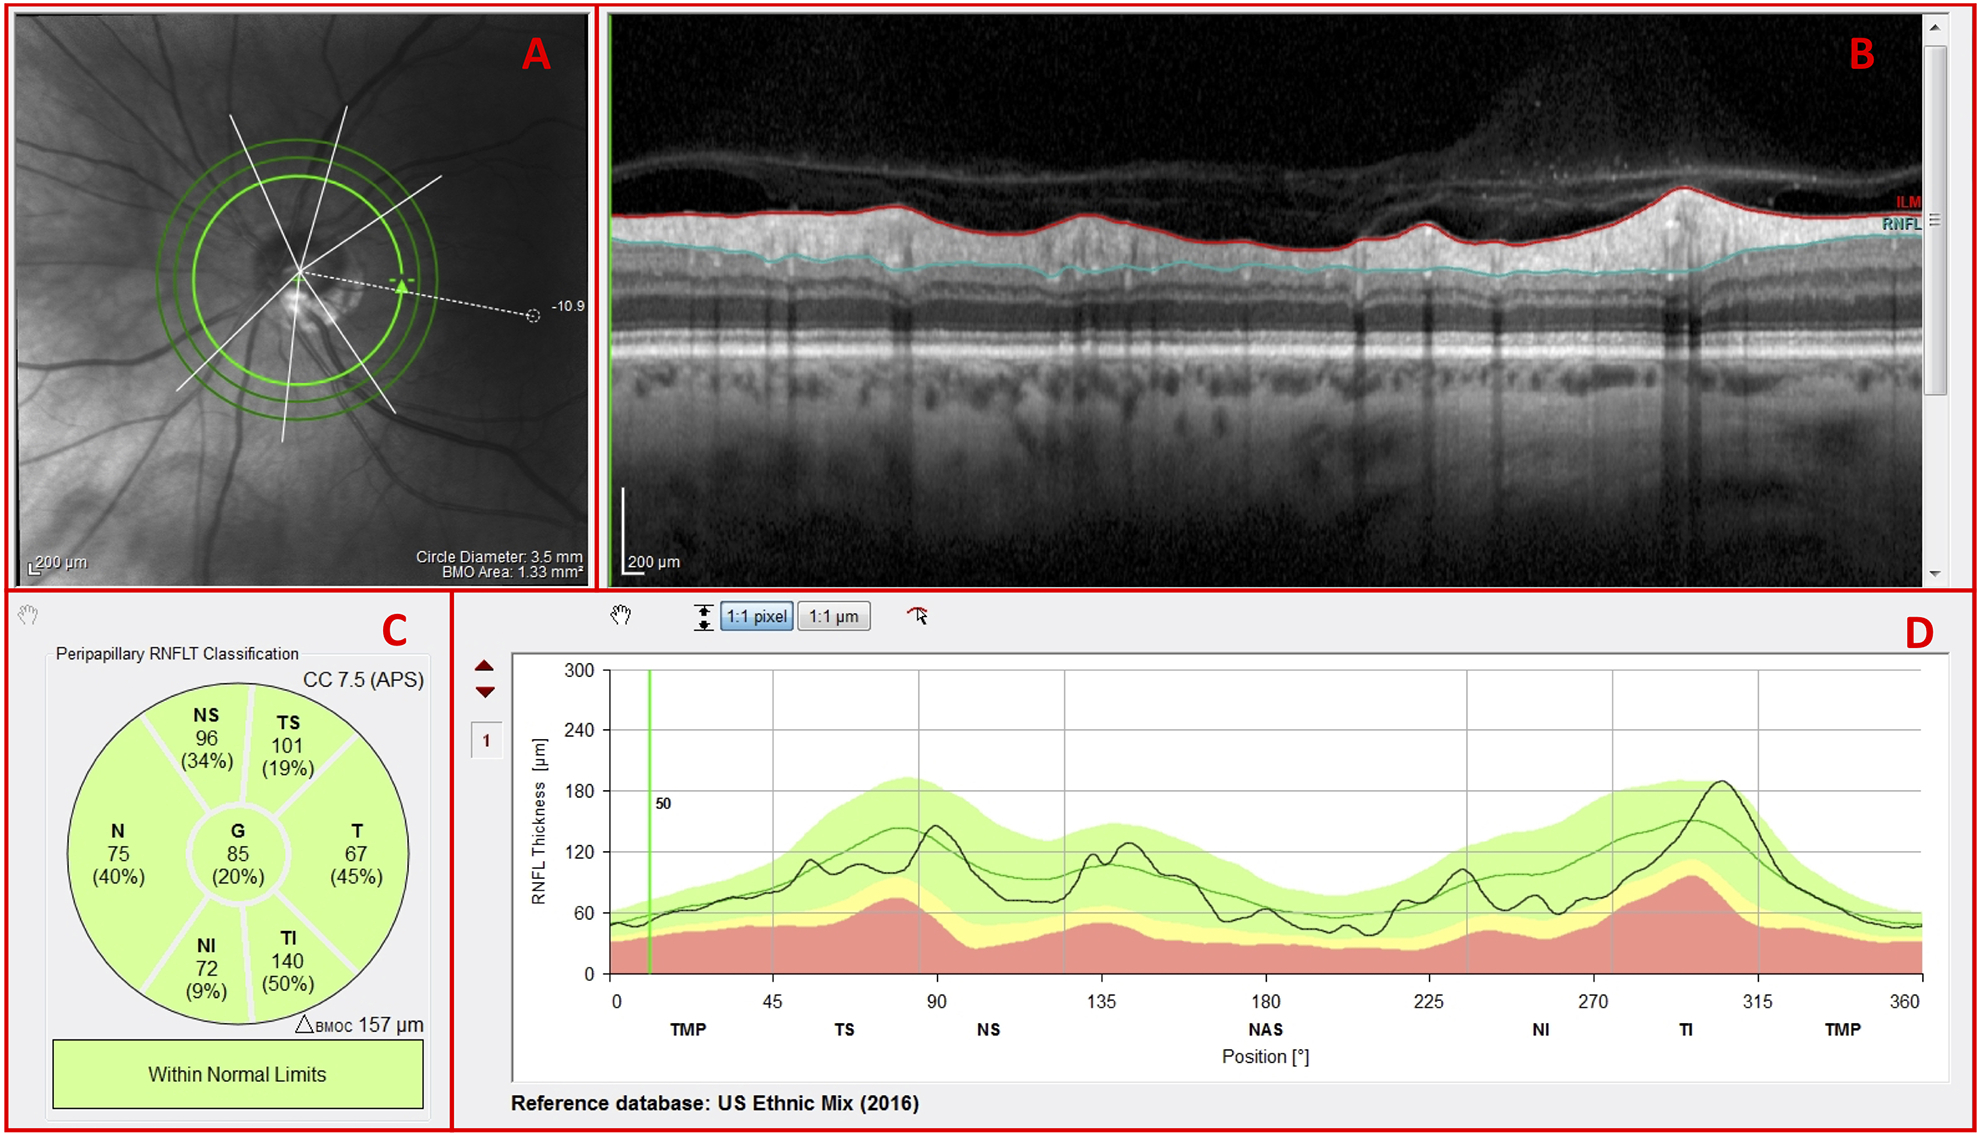
Spectralis HRA+OCT commercial circle scan report with an (A) infrared (IR) projection of the disc, (B) averaged circular b-scan image, (C) cpRNFL thickness pie chart, and (D) cpRNFL thickness profile
Official websites use .gov
A
.gov website belongs to an official
government organization in the United States.
Secure .gov websites use HTTPS
A lock (
) or https:// means you've safely
connected to the .gov website. Share sensitive
information only on official, secure websites.
Spectralis HRA+OCT commercial circle scan report with an (A) infrared (IR) projection of the disc, (B) averaged circular b-scan image, (C) cpRNFL thickness pie chart, and (D) cpRNFL thickness profile