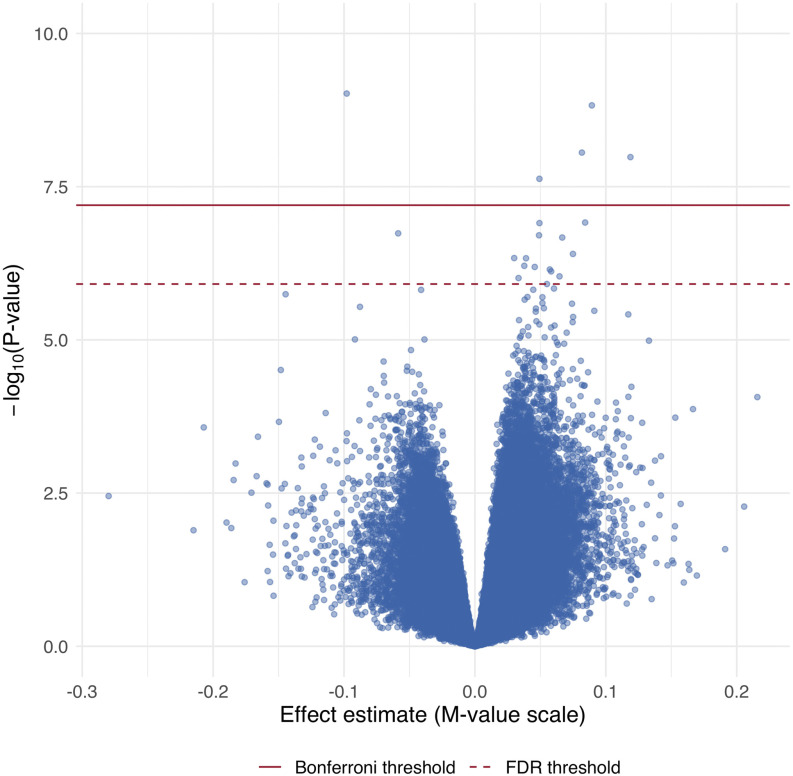
Figure 2.
Volcano plot for the epigenome-wide association of log(total urinary arsenic levels) and DNA methylation levels. Limma models adjusted for age, sex, BMI, self-reported smoking status, education (, high school graduate or GED, ), study center (Arizona, Oklahoma, North and South Dakota), estimated glomerular filtration rate, and cell-type proportion estimates. The solid line represents the Bonferroni threshold and the dashed line represents the FDR threshold for significance. Note: BMI, body mass index; FDR, false discovery rate; GED, General Education Diploma.

