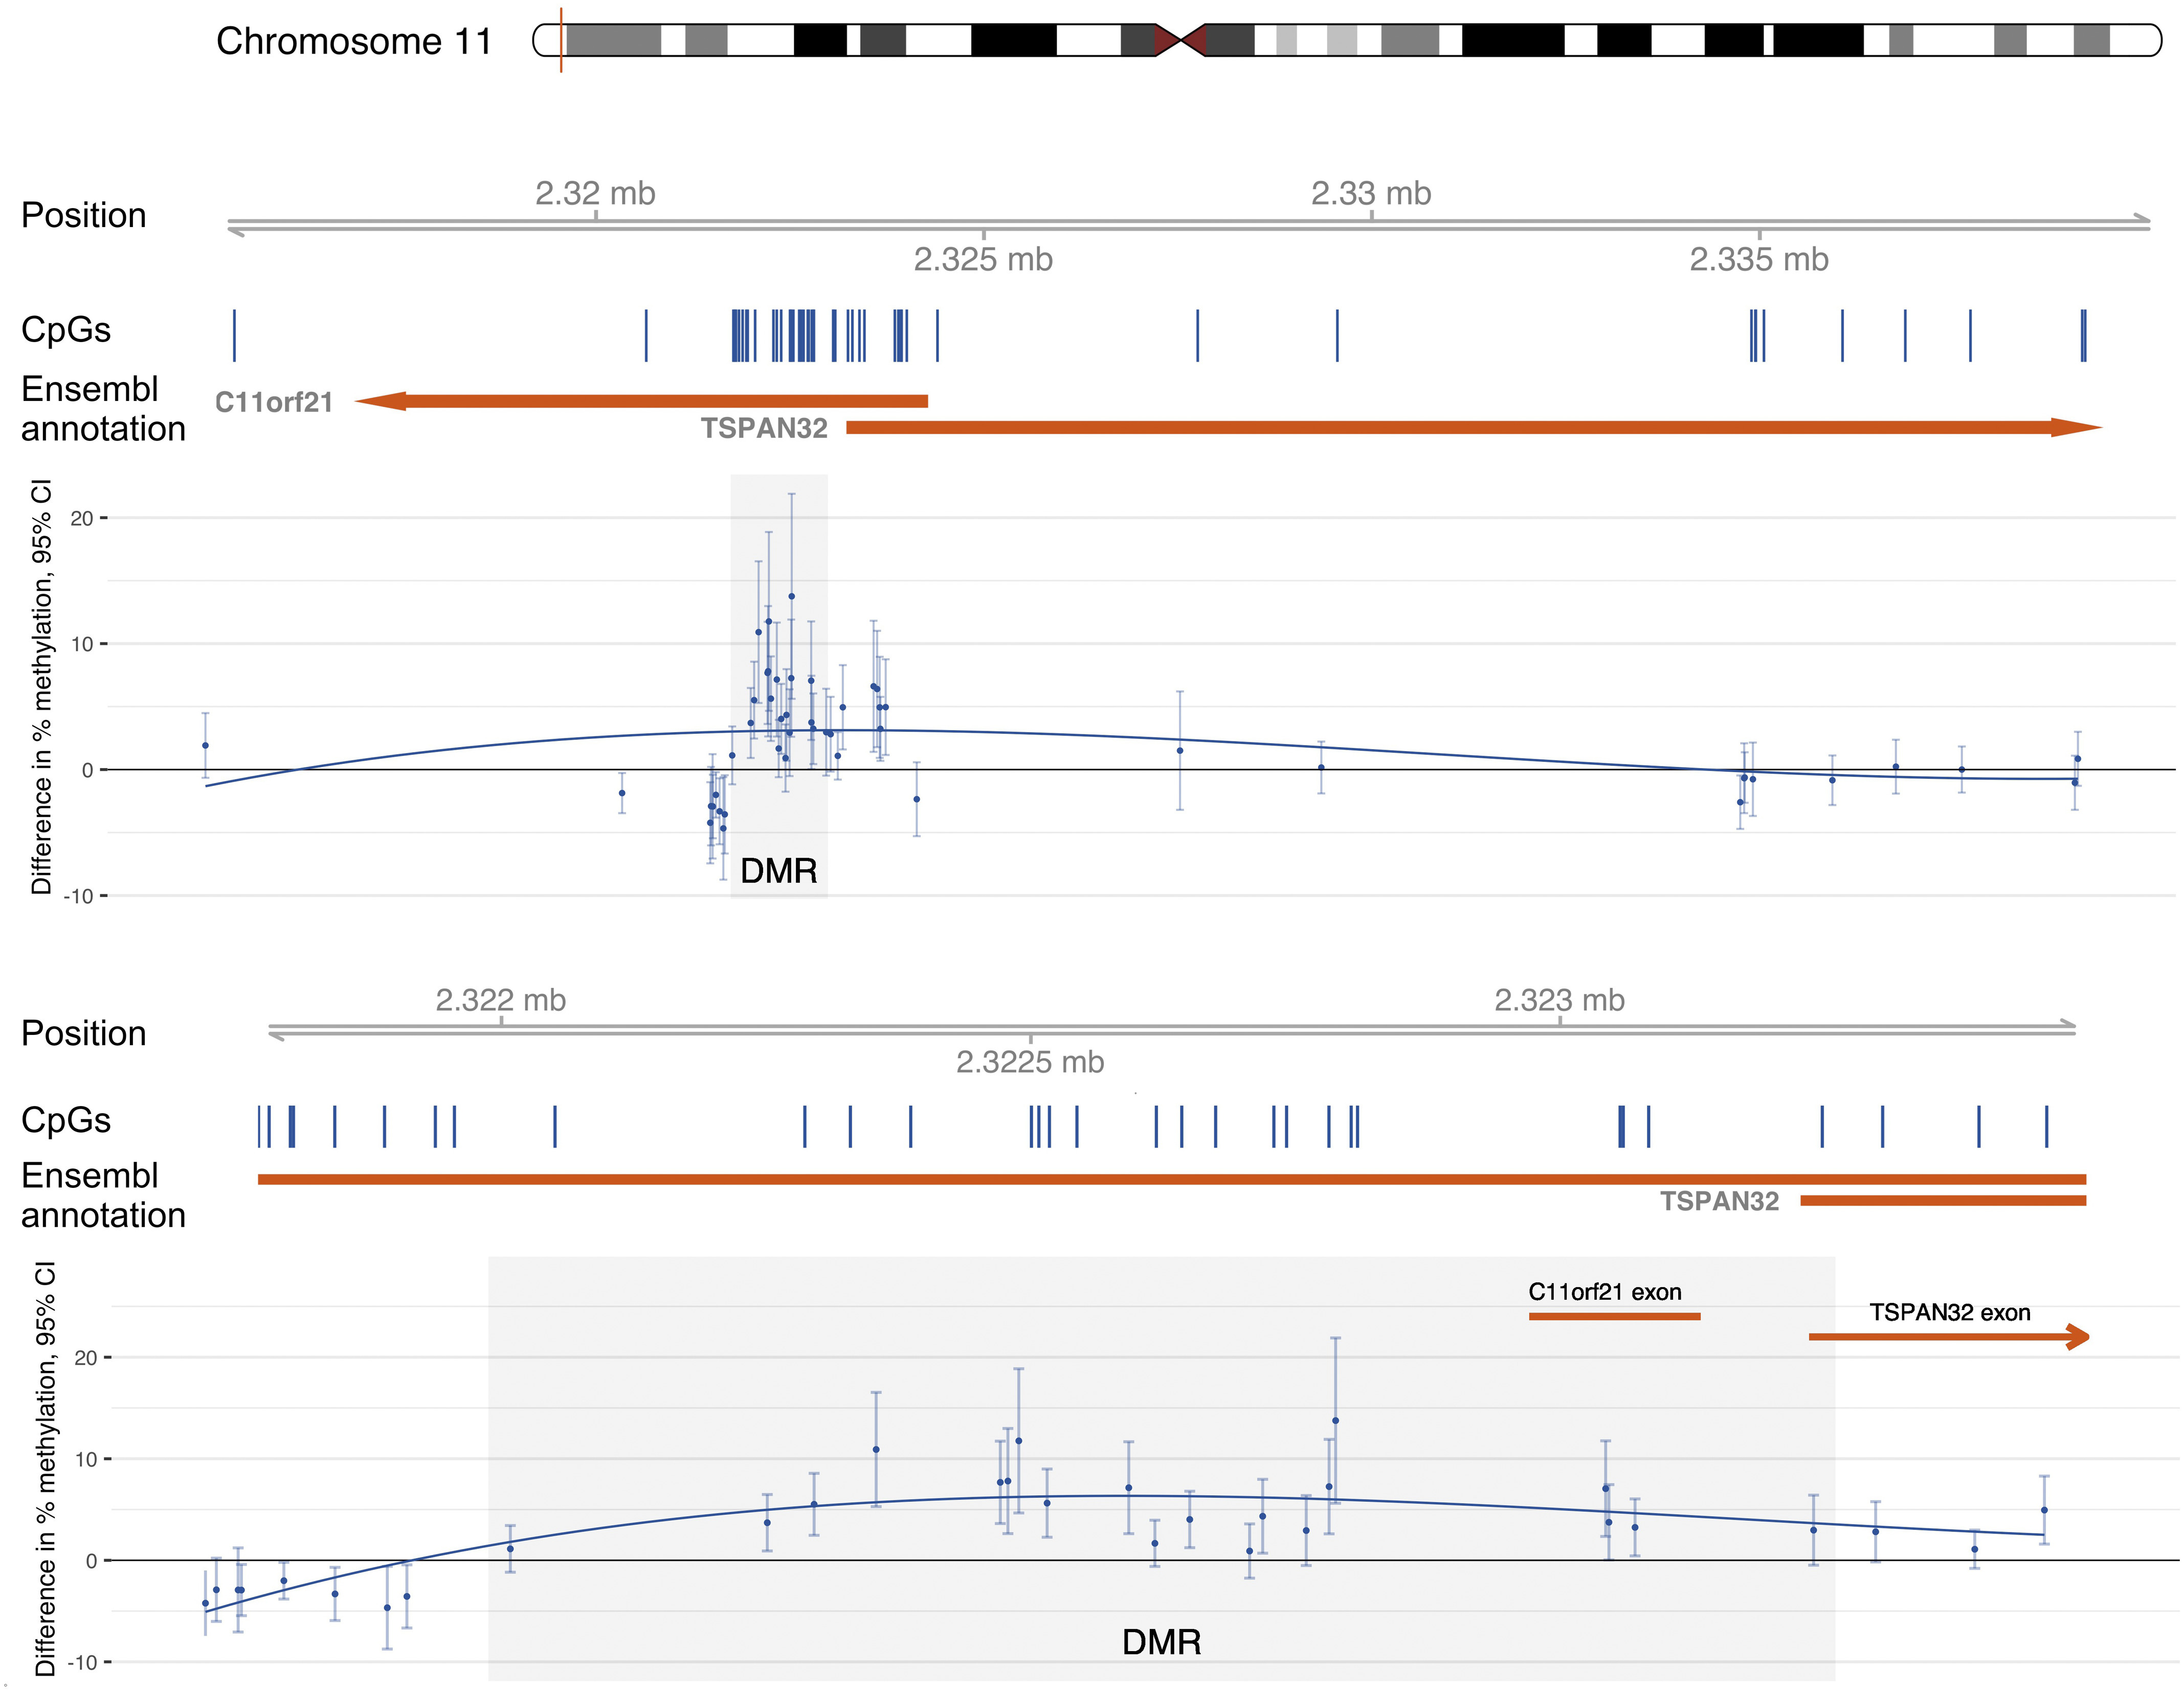
Figure 3.

Epigenome-wide association results in the genomic region containing the differentially methylated region (DMR) chr11:2,322,050-2,323,247 (shaded area). The first panel shows the region from 7,000 nucleotides upstream of the DMR to 17,000 nucleotides downstream of the DMR; the second panel shows the region from 300 nucleotides upstream of the DMR to 300 nucleotides downstream of the DMR. Difference in % methylation from limma models of Beta-values [i.e., mean difference in percent methylation for each unit change in ln(total urinary arsenic levels)] adjusted for age, sex, BMI, self-reported smoking status, education (, high school graduate or GED, ), study center (Arizona, Oklahoma, North and South Dakota), estimated glomerular filtration rate, and cell type proportion estimates. Trend in odds of methylation related to As levels is indicated by a solid blue line fitted using polynomial splines. Note: BMI, body mass index; GED, General Education Diploma.
