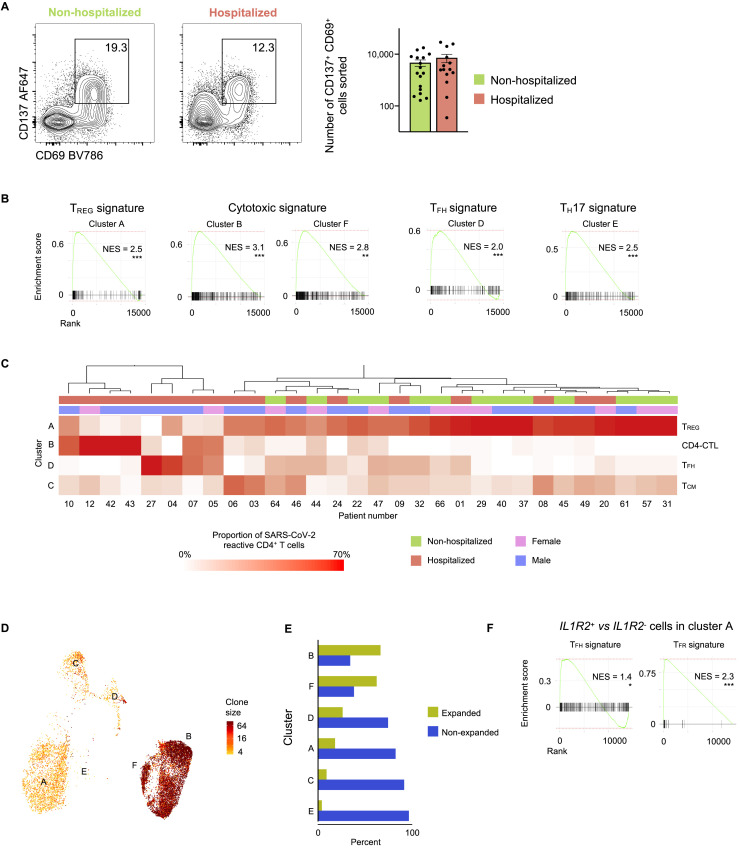
Figure S5.
Analysis of SARS-CoV-2-Reactive CD4+ T Cells from 24 h Stimulation Condition, Related to Figure 5
(A) Representative FACS plots showing surface staining of CD137 and CD69 in memory CD4+ T cells stimulated for 24 h with SARS-CoV-2 peptide pools, post-enrichment (CD137-based), in hospitalized and non-hospitalized COVID-19 patients (left). Summary of number of cells sorted in 14 hospitalized and 17 non-hospitalized COVID-19 patients (right); data are mean ± SEM.
(B) GSEA for TREG, cytotoxicity, TFH and TH17 signature genes in a given cluster compared to the rest of the cells; ∗∗p < 0.01; ∗∗∗p < 0.001.
(C) Unsupervised clustering of 17 hospitalized and 13 non-hospitalized COVID-19 patients based on the proportions of SARS-CoV-2-reactive CD4+ T cells in different clusters following 24 h peptide stimulation. Clusters with fewer than 5% of the total dataset are not depicted. Hospitalization status (red versus green) and sex (pink versus blue) are indicated in the annotation rows immediately below the dendrogram.
(D) UMAP showing TCR clone size (log2, color scale) of SARS-CoV-2-reactive cells from COVID-19 patients (24 h stimulation condition).
(E) Proportion of clonally expanded (clone size >2) and non-expanded cells in each cluster (24 h stimulation condition).
(F) GSEA for TFH and TFR signature genes in IL1R2+ cells compared to IL1R2– cells in cluster A; ∗p < 0.05; ∗∗∗p < 0.001.

